
Social Les médias sociaux : en quelle année sont-ils apparus ? How To Be Productive #Infographic. Working from home #infographic. The high cost of free #infografia #infographic ... The Sophisticated Marketer’s Checklist for LinkedIn - infographic. DIGITAL MARKETING - Top Content ... DIGITAL MARKETING - Top Content ... #Famous #Movie #Quotes #Infographic. El lenguaje corporal en los negocios ... The psychology of lying #infographic. The psychology of lying #infographic. The 7 archetypes of Twitter accounts #infografia ... Pinterest. 6 mind-blowing Social Media Statistics #socialmedia ... Pinterest. Estadísticas sobre Pinterest #infografia ... Social Media: A History #infographic #social. Francesco Franchi – Infographics. A Visual Definition. How To Be Productive #Infographic. The Ultimate List of Educational Websites via ... Social-media-map.pdf.
#FORMATION #FREE : Introduction à l’infographie et la visualisation de données by @AlbertoCairo #dataviz. Avec L’explosion de du journalisme de données Je ne saurais vous conseiller le récent ouvrage ” Guide du Data Datajournalism” Sortie aux editions Eyrolle Voila une Trés bonne nouvelle qui arrive du TEXAS (oui c’est possible).
Un MOOC ( en anglais : massive open online course ) Introduction à l’infographie et la visualisation de données “Introduction à l’infographie et la visualisation de données ” est le premier cours offert par le Knight Center gràce au service de MOOC de l’université du Texas ( à noté qu’il ont une section specialisée sur l’imagerie scientifique aussi). Le projet à été lancé en Octobre 2012, est rapidement devenu un pionnier dans l’enseignement en ligne massif du journalisme, avec attaché à la volonté de développer le journalisme Les cours du Knight Center sont créés spécifiquement pour une diffusion massive et cherchent à encourager le plus grand nombre d’ élèves / étudiants vers une forte interactions enseignants / étudiants . Alberto conseilles la lecture. System of my relationships, by Csönge Balla. [This is a guest post by Csönge Balla*, about her infographic project "System of my Relationships"] In the spring semester of 2013, one of our projects at the Hungarian University of Fine Arts was to design an infographic poster of our relationships.
As I have many acquaintances from various places and periods of my life, I wanted this to appear on my infographic, too. That’s why I decided to display much data and build a rather complex visual system of my relationships. Having set dimensions of the poster also helped: I was able to plan with tiny details, because we had to design a 70×100 poster. The visual design and data-gathering processes developed together during the work. This is Visual Journalism [31] Similarly to previous posts, the topic in hand in this edition of This is Visual Journalism is the situation in Syria.
![This is Visual Journalism [31]](http://cdn.pearltrees.com/s/pic/th/this-is-visual-journalism-loop-65440001)
Some of the best infographic departments in the world have been depicting the details of the escalating threat of an international intervention in the country, and we brought a few of those works, alongside others covering different topics. A special mention, before we start, to Saul Castillo‘s Inconsolata blog, that compiled more infographics about the situation in Syria in this post.
Hope you enjoy today’s selection: Tension in Syria | Diana Estefania | La Razón. Trucs et astuces pour créer une belle (et riche) infographie. Vous vous souvenez ?
Big Data is Big Business in Banking. Market Intelligence Investments ROI. 1 Flares Twitter 1 Facebook 0 Google+ 0 Pin It Share 0 1 Flares × Market Intelligence Investments ROI.
Beyond “like” and “follow us.” The next stage ... Link building anatomy 2012 #Infographic. What is your Social Media personality? ... 7 Key Steps to Creating an Awesome Infographic. The younger generation would rather watch a 2 minute video than read a page of text. How do I know that? …because I asked them. Last week I was standing in front of thirty young adults aged from 18 to 25 at the International College of Management and I posed the question. “Would you rather read a blog article or watch a 2 minute video?” Twenty five of the thirty put up their hand and said ”video!” This maybe not the scientific method preferred by mathematicians with PhD’s and avid students of statistics, but it’s fast and efficient and measures the beat of the street.
That crowd is not getting any younger and in fact they are becoming your mainstream audience as they move into management and create startups. This is a challenge for marketers and bloggers. 5 Killer Facebook Marketing Infographics. 0Share 0Share 0Tweet 0Share 0Share 645inShare Jeffbullas's Blog Internet Marketing.

Digital Cartography [4] Security threats by the numbers. Email_marketing. SXSW Revealed: What Really Happens on A Typical Day (and Night) 10 Flares Twitter 9 Facebook 1 Google+ 0 Pin It Share 0 10 Flares × SXSW Revealed: What Really Happens on A Typical Day (and Night)
Content Marketing Explained in a Dynfographic by MandLoys. Infographie_Randstad-Award_2013. L’avènement des « infographies » Evaluez votre Page Fan Facebook avec cet Aide-Mémoire [Infographie] Social Media & Marketing / Public or private: the risks of posting in #social networks - #SocialMedia. Green building’s many benefits. The Future of Big Data. Can We Teach Compassion? [Infographic] « B2B-TechCopy Technology Marketing Blog. 5 Reasons Why Facebook Drives Consumer Buying - Infographic. Facebook provides a wide ranging and encompassing online social network ecosystem that allows you to share music, photos and information that can be seen by your friends in their timeline and ticker.
Its impact is also starting to be seen as influencing consumer decisions as people notice online comments by friends on Facebook and make purchases based on this sharing. Facebook’s role in the socialization of the online buying process continues to expand as it entrenches its presence as the social network of choice globally for over 800 million users. In fact it is is predicted that Facebook will hit the 1 billion user mark by August. Some of the power of Facebook in the online shopping environment is in its ability for people to share what products they like to their friends and also highlight their buying decisions. 5 Insights into Global Social Media in 2012 [Infographic]
Social media is emerging from its adolescent phase and is rapidly maturing.
![5 Insights into Global Social Media in 2012 [Infographic]](http://cdn.pearltrees.com/s/pic/th/insights-global-infographic-34943997)
Initially social networks had an image problem with some CEO’s and executives thinking Facebook was for teenagers to post the weekend’s party photos and Twitter was for narcisstic attention seekers with a limited vocabulary. There was also an initial perception that because the platforms were free to use that participating was cheap and easy. Experience has shown otherwise. Social media, blogging and digital content creation are resource intensive and doing it right takes time and money. Tools and time saving apps are emerging to help companies to be more efficient and able to manage, control and monitor social media. Social media has grown up and is now accepted as mainstream by companies including the Fortune Global 100. Facebook , Twitter, Google+, YouTube and the fast emerging Pinterest have all been embraced by the top companies as they find ways to leverage their brands globally. 1. 2. 3. 4. 5.
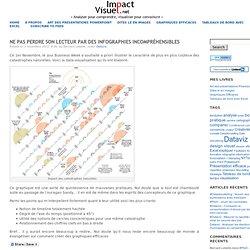
Ne pas perdre son lecteur par des infographies incompréhensibles. Ce 1er Novembre, le jour Business Week a souhaité a priori illustrer le caractère de plus en plus coûteux des catastrophes naturelles.
Le responsive design expliqué à ma grand-mère ! Infographie: Optimisez votre marketing relationnel. ?utm_source=dlvr. Infographic: Which States Have the Worst Air? - Environment. ?utm_source=dlvr. Guide de dimensions des images pour vos médias sociaux. Hark. Une très très très courte histoire de la typographie. #infography. [Infographie] Quel utilisateur des médias sociaux êtes vous? » Brand E-reputation. Crayola Crayon Chronology. 20 Reasons to Switch to Google+ [INFOGRAPHIC] Thinking of truly embracing Google+ as your go-to social network of choice? The folks at Infographic Labs have put together a compelling infographic as to why the Google service is worth your time. Rhetological Fallacies. Infographic of Who’s Who Of Social Influence Measurement Klout Rules.
Izing Pi. Social-Media-Demographics-972. Concevoir, lire et comprendre, évaluer un wireframe. Images : Les smartphones peuvent finir par nous tuer - Infographie Smartphones. The Marketers Guide to Pinterest - Infographic. Humans are extremely visual. We experience life visually and the role of photos, images and videos in our life is evidenced by the sheer quantity (250 million a day) of photos of friends, family and cute dogs that are uploaded to Facebook every day .
I remember returning from the annual summer holidays and my father would invite all our friends over to view the photos and videos that he had taken on the yearly trip. The visual record of the trip was a vital part of the the sharing of the stories and experiences that had occurred in our family travels. Photos are highly engaging and the rise of Pinterest to become the 60th most visited site in the US last month provides more data to verify the attractiveness of beautiful images on this visual pinboard social media network site. So Who is Using Pinterest? Well according to the numbers it appears that women are the largest participants at 87%. Envisioning the future of technology — by Michell Zappa. Thought leadership in branding and digital marketing. My friend Yael Rozencwajg (Yopps) and I created this infographic to explain what is and wherein lies the value of a Facebook fan.
The short story is that there is no way to place a single value on a fan. The answer is that “it depends.” Not only are some fans worth more than others, but the way you build up engagement on your page makes the value of a fan more or less potent. While this infographic is directed toward Facebook, the concept is equally valid for any social media strategy and other social media platforms (Twitter, Google+…). In any event, ultimately, the value of your fanbase depends on how much you truly care about your customers. Please let us know your comments! Le palmarès des villes sous surveillance.
The state of the global spy game: Graphic. [Infographie] LeWeb’11 en chiffres et en images ! [Infographie] Généalogie du jeu vidéo. La carte du monde des réseaux sociaux.
2010. Internet et les TPE en France.