
The Art of Complex Problem Solving. 6 גישות וסגנונות לעיצוב והגשה של מצגת שלא הכרתם עד היום! - goodpoint goodpoint. לאורך השנים האחרונות תחום הפרזנטציה התפתח רבות ואתו התפתחו סגנונות העיצוב וההגשה של הפרזנטציה.
עברנו ממצב שבו פרזנטציה הייתה חלק מפגישות עבודה רשמיות למצב בו ישנם מפגשים חברתיים שבמרכזם הרצאות שאנשים נותנים בשביל הכיף (נסקור את חלקם בהמשך). במאמר זה אסקור את הגישות הנפוצות ביותר נכון לסוף שנת 2014. גישת גודין: גישת גודין הקרויה על שמו של גורו השיווק סט גודין, מבוססת על רעיון אחד: שאומנות הפרזנטציה מורכבת משני מרכיבים שונים, המרצה והשקופיות.
מדהים נכון? אז באמת מדובר בקונספט מדהים. מהצד השני יש לנו את השקופיות. גודין לא משתמש במילים בשקופיות שלו אלה מרכז את תשומת לב הקהל בעזרת תמונה חזקה שמעבירה את הרעיון המורכב שאותו הוא מציג בעל פה. גישת תאקאשי: מסיושי תאקאשי (Masayoshi Takahashi) , מתכנת מחשבים אשר בשלב מסוים בחייו נידרש להעביר הרצאה בכנס טכנולוגי וזאת מבלי שתהיה לו גישה לתמונות, תוכנות לעריכה ואפילו ,POWER POINT כך שהדבר היחידי שהיה זמין לו היה טקסט (סיוט נכון?). תאקאשי התחיל את התהליך בלחשוב על מילה אחת שתייצר אפקט מקסימלי בכול שקופית. Educational Technology and Mobile Learning: Interesting Visual- Teacher with Growth Mindset Vs Teachers with Fixed Mindset. 6 Tips To Use Colors When Designing eLearning Courses Infographic. E-Learning Infographics 6 Tips To Use Colors When Designing eLearning Courses Infographic Color Psychology for eLearning Design Use Color to Direct Attention Color can help reduce boredom and passivity, thus improving attention spans.
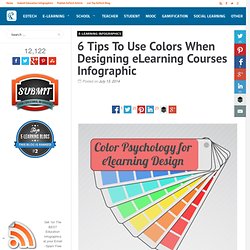
Research has found that 80% of information processed by the brain of an Internet user comes from sight and yet other studies have discovered that people are exceptionally sensitive to visual cues when learning. These two pieces of information suggest that visual content is a key factor in eLearning and applying graphic techniques appropriately could enhance knowledge acquisition. One way to utilize the power of visual tools is through the use of color. eLearning developers must familiarize with color psychology before start designing. Via: info.shiftelearning.com. כלים להצגה חזותית. Create Interactive Online Presentations, infographics, animations & banners in HTML5 - Visme by Easy WebContent. Let's look at the statistics of how we process information.

Did you know that 90% of the incoming information in your brain is visual? A majority of us are visual learners. There is also a theory doing the rounds of the Net that your brain can process visual information 60,000 times faster. Transform otherwise boring data into engaging visuals that will turn heads and get the point across. We give you our custom built infograph widgets, charts and graphs to quickly visualize your data to engaging content. 16 Websites and Apps for Making Videos and Animation. Diagramming Community. 5 Ways To Leverage Visual Design For Better eLearning. Myth: visuals are just decoration and don’t really impact learning.
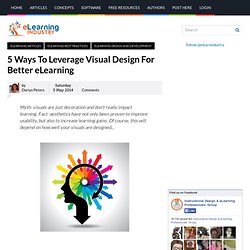
Fact: aesthetics have not only been proven to improve usability, but also to increase learning gains. Of course, this will depend on how well your visuals are designed... In my book Interface Design for learning, I look in depth at how graphics, multimedia and other elements of the interface design can literally boost learning gains. Here are five foundational strategies drawn from the book. Think Quiet designOne of the most important roles visual design can play in eLearning is to get out of the way. 10 Blended Learning Trends Infographic. Blended Learning Infograpics The 10 Blended Learning Trends Infographic gives a snapshot on how making student learning more personalized, more engaging, and more collaborative is what’s driving innovation.
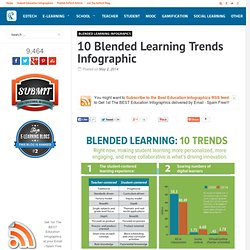
The student-centered learning experienceSoaring numbers of digital learnersBuilding higher-order thinking skillsRealizing benefits for both teachers and studentsA framework for data-driven decision-making in educationPersonalized learning accompanied by a lean, blended, interactive approachProductive GamificationThe mobile world is where learner live nowStudents’ personal access to mobile devicesMore broadband, please! Via: www.dreambox.com. כלים להצגה חזותית. iPiccy: Free Online Photo Editing for You. Teachers: The Happiest Profession on the Planet? Infographic.
Teacher Infographics Despite a common image of an overworked, grumbling about pay teacher, several different studies around the globe independently revealed an amazing fact: people who choose to be teachers are happier than the majority of other professionals.
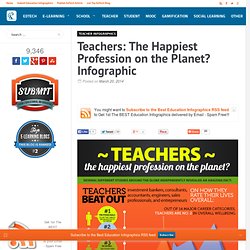
Via: busyteacher.org. Educational Technology Development Stages for Kids Infographic. Educational Technology Infographics Elementary School Infographics Kindergarten Infographics Other Infographics Today, most Gen Xers and Gen Yers didn’t receive their first cellphone until they were in high school, maybe even college or later.
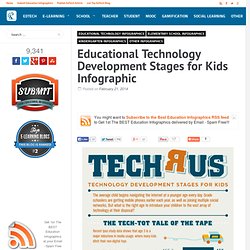
But these days, children are getting their hands on mobile devices at a younger age every day. According to a new study, kids are ditching their nondigital toys by age three and turning their attention to smartphones and tablets. In fact, data shows that five-year-olds are using computers on a routine basis. So, when is the right age to introduce children to technology? Via: www.rasmussen.edu. Goodpoint - כל מה שצריך לדעת על עמידה בפני קהל ובניית מצגת מנצחת! Goodpoint. כלים ליצירת אינפוגרפיקה. אינפוגרפיקה. Myths and Facts about Copyright Infringement Infographic. Other Infographics Student Infographics Teacher Infographics There are a lot of Copyright myths and misunderstandings – particularly when it comes to Internet Copyright Infringement.

The Myths and Facts about Copyright Infringement Infographic explains how to avoid breaching Copyright and how to protect teachers and students from Copyright Infringement online. Via: legal123.com.au.
Digital vs Visual Literacy - New Literacies Project. Digital Literacy: Digital literacy is the use of computers and technology and how someone uses and interacts with it.
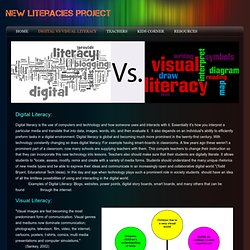
Essentially it's how you interpret a particular media and translate that into data, images, words, etc. and then evaluate it. It also depends on an individual's ability to efficiently preform tasks in a digital environment. Digital literacy is global and becoming much more prominent in the twenty-first century. With technology constantly changing so does digital literacy. Visual Literacy: "Visual images are fast becoming the most predominant form of communication. Students are constantly surrounded by visuals making it a fundamental part of their day to day learning.Visual literacy is interpreting and evaluating images, animations, words, and symbols while also integrating sensory experiences.
Visual literacy also includes other elements such as font, texture, size, shape, color, angel, repetition, balance, layout, space, contrast, alignment, proximity and position. Visual Thinking Strategies. Infographics.
דוגמאות בתחומים אחרים. מהי אינפוגרפיקה+מדריכים. אוריינות חזותית בפדגוגיה ובמרחב הלמידה- לימור ליבוביץ: מתי לאחרונה לימדתם את התלמידים לצייר דיאגרמה?