
How to perform a Logistic Regression in R. Logistic regression is a method for fitting a regression curve, y = f(x), when y is a categorical variable.
The typical use of this model is predicting y given a set of predictors x. The predictors can be continuous, categorical or a mix of both. The categorical variable y, in general, can assume different values. In the simplest case scenario y is binary meaning that it can assume either the value 1 or 0. A classical example used in machine learning is email classification: given a set of attributes for each email such as number of words, links and pictures, the algorithm should decide whether the email is spam (1) or not (0).
R. Framework And Applications Of ARIMA Time Series Models. Quick Recap Hopefully, you would have gained useful insights on time series concepts by now.
If not, don’t worry! You can quickly glance through the series of time series articles: Step by Step guide to Learn Time Series, Time Series in R, ARMA Time Series Model. This is the fourth & final article of this series. A quick revision, till this point we have covered various concepts of ARIMA modelling in bits and pieces. Auto-Regression & Moving-Average Time Series - Simplified. ARMA models are commonly used for time series modeling.
In ARMA model, AR stands for auto-regression and MA stands for moving average. If the sound of these words is scaring you, worry not – we will simplify these concepts in next few minutes for you! Pedagogy In this article, we will develop a knack for these terms and understand the characteristics associated with these models. But before we start, you should remember, AR or MA are not applicable on non-stationary series. Data Scientist. rCharts. Set Working Directory in R. If you want to read files from a specific location or write files to a specific location you will need to set working directory in R.
The following example shows how to set the working directory in R to the folder “Data” within the folder “Documents and Settings” on the C drive. # Set the working directory setwd("C:/Documents and Settings/Data") Remember that you must use the forward slash / or double backslash \\ in R! The Windows format of single backslash will not work.
Beautiful tables for linear model summaries #rstats. In this blog post I’d like to show some (old and) new features of the sjt.lm function from my sjPlot-package.
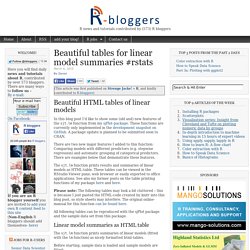
These functions are currently only implemented in the development snapshot on GitHub. A package update is planned to be submitted soon to CRAN. There are two new major features I added to this function: Comparing models with different predictors (e.g. stepwise regression) and automatic grouping of categorical predictors. There are examples below that demonstrate these features. The sjt.lm function prints results and summaries of linear models as HTML-table. Please note: The following tables may look a bit cluttered – this is because I just pasted the HTML-code created by knitr into this blog post, so style sheets may interfere. 3 big universities proclaim: Learn data science online! Learn to crunch big data with R. A few years ago I was the CTO and co-founder of a startup in the medical practice management software space.
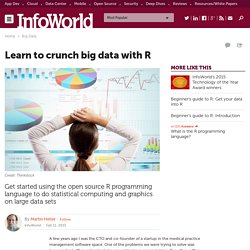
One of the problems we were trying to solve was how medical office visit schedules can optimize everyone’s time. Too often, office visits are scheduled to optimize the physician’s time, and patients have to wait way too long in overcrowded waiting rooms in the company of people coughing contagious diseases out their lungs. One of my co-founders, a hospital medical director, had a multivariate linear model that could predict the required length for an office visit based on the reason for the visit, whether the patient needs a translator, the average historical visit lengths of both doctor and patient, and other possibly relevant factors. One of the subsystems I needed to build was a monthly regression task to update all of the coefficients in the model based on historical data.
50 Things Everyone Should Know How To Do. How to get drop down list in excel - Buscar con Google. Export tables to Excel. A new feature in Stata 13, putexcel, allows you to easily export matrices, expressions, and stored results to an Excel file.
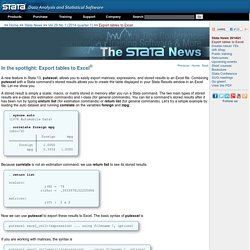
Combining putexcel with a Stata command’s stored results allows you to create the table displayed in your Stata Results window in an Excel file. Let me show you. Welcome to the London Datastore. Time Series ARIMA Models - Econometrics Academy. Excel Charting Samples for Microsoft .NET, ASP.NET, C#, VB.NET, XLS and Microsoft Visual Studio .NET. Richly formatted workbooks with fast and complete calculations are the heart and soul of a spreadsheet, but the ability to make good decisions is greatly enhanced by the ability to visualize data.
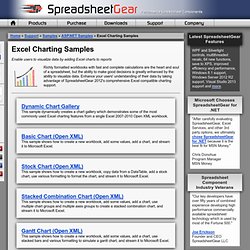
Enhance your users' understanding of their data by taking advantage of SpreadsheetGear 2012's comprehensive Excel compatible charting support. This sample dynamically creates a chart gallery which demonstrates some of the most commonly used Excel charting features from a single Excel 2007-2010 Open XML workbook.
Programming Stata. This section is a gentle introduction to programming Stata.
We discuss macros and loops, and show how to write your own (simple) programs. ARIMA Modelling of Time Series. Description Fit an ARIMA model to a univariate time series.
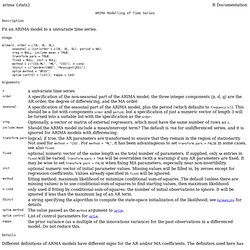
Usage arima(x, order = c(0L, 0L, 0L), seasonal = list(order = c(0L, 0L, 0L), period = NA), xreg = NULL, include.mean = TRUE, transform.pars = TRUE, fixed = NULL, init = NULL, method = c("CSS-ML", "ML", "CSS"), n.cond, SSinit = c("Gardner1980", "Rossignol2011"), optim.method = "BFGS", optim.control = list(), kappa = 1e6) Arguments. Time Series ARIMA Models. 8.7 ARIMA modelling in R. How does auto.arima() work ? The auto.arima() function in R uses a variation of the Hyndman and Khandakar algorithm which combines unit root tests, minimization of the AICc and MLE to obtain an ARIMA model. The algorithm follows these steps. Hyndman-Khandakar algorithm for automatic ARIMA modelling The number of differences $d$ is determined using repeated KPSS tests.The values of $p$ and $q$ are then chosen by minimizing the AICc after differencing the data $d$ times. Rather than considering every possible combination of $p$ and $q$, the algorithm uses a stepwise search to traverse the model space.
Choosing your own model If you want to choose the model yourself, use the Arima() function in R. R code. Data Visualization. R-related. 46-hidden-tips-and-tricks-to-use-google-search-like-a-boss.png (PNG Image, 600 × 6115 pixels) - Scaled (16%) FAQ: Using a plugin to connect to a database. How do I connect to a database by using a Stata plugin? ODBC vs. plugin The easiest way to import data from a database directly into Stata is to use the odbc command. However, there are occasions where the odbc command will not work or is not the best solution for importing data. For example, the odbc command will not work on your operating system (Solaris), there is not an ODBC driver for the database in question, or ODBC is too slow.
If you encounter any of the above problems, you can use a Stata plugin to import and export your data directly to your database if your database has an application programming interface (API). This FAQ assumes that you have read and understood the FAQ on Stata plugins at the following URL: The example will use ANSI C as the plugin langauge and gcc as the compiler. The Comprehensive R Archive Network. The R Project for Statistical Computing. Data Management. Quick-R: Home Page. Visual overview for creating graphs.