
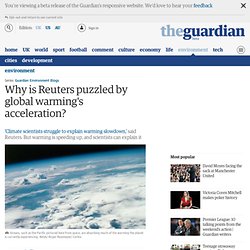
Ice_Age_Temperature.png (PNG-Grafik, 564 × 377 Pixel) CO2-Konzentration in der Atmosphäre über... Why is Reuters puzzled by global warming's acceleration? The rate of heat building up on Earth over the past decade is equivalent to detonating about 4 Hiroshima atomic bombs per second.
Take a moment to visualize 4 atomic bomb detonations happening every single second. That's the global warming that we're frequently told isn't happening. There are periods when the ocean heats up more quickly than the surface, and other periods when the surface heats up more quickly than the oceans. Right now we're in a period of fast ocean warming and overall, global warming is continuing at a very fast pace. Scientists Present 1998 Earth-Temperature Trends. Space Science News home Scientists Present 1998 Earth-Temperature Trends Updated 20-year temperature record unveiled at 1999 AMS Meeting January 12, 1999: Since late1978, polar-orbiting satellites have monitored the microwave emissions from oxygen in the Earth's atmosphere.
Tropical cyclogenesis. Tropical cyclogenesis is the development and strengthening of a tropical cyclone in the atmosphere.[1] The mechanisms through which tropical cyclogenesis occurs are distinctly different from those through which mid-latitude cyclogenesis occurs.
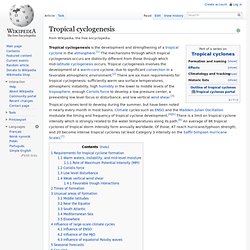
Tropical cyclogenesis involves the development of a warm-core cyclone, due to significant convection in a favorable atmospheric environment.[2] There are six main requirements for tropical cyclogenesis: sufficiently warm sea surface temperatures, atmospheric instability, high humidity in the lower to middle levels of the troposphere, enough Coriolis force to develop a low pressure center, a preexisting low level focus or disturbance, and low vertical wind shear.[3] Tropical cyclones tend to develop during the summer, but have been noted in nearly every month in most basins. Requirements for tropical cyclone formation[edit] Depth of 26 °C isotherm on October 1, 2006 Warm waters, instability, and mid-level moisture[edit] Coriolis force[edit]
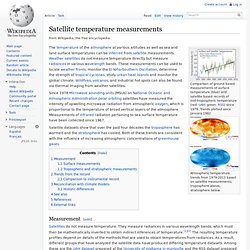
MSU temperature measurements. Comparison of ground based measurements of surface temperature (blue) and satellite based records of mid-tropospheric temperature (red: UAH; green: RSS) from 1979-2009.
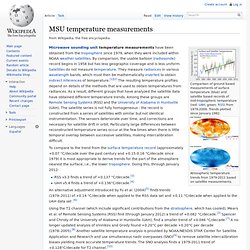
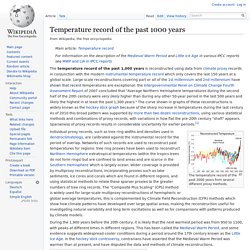
Trends plotted since January 1982. Atmospheric temperature trends from 1979-2011 based on satellite measurements. Microwave sounding unit temperature measurements have been obtained from the troposphere since 1979, when they were included within NOAA weather satellites. By comparison, the usable balloon (radiosonde) record begins in 1958 but has less geographic coverage and is less uniform. Satellites do not measure temperature. To compare to the trend from the surface temperature record (approximately +0.07 °C/decade over the past century and +0.15-0.16 °C/decade since 1979) it is most appropriate to derive trends for the part of the atmosphere nearest the surface, i.e., the lower troposphere.
RSS v3.3 finds a trend of +0.137 °C/decade.UAH v5.4 finds a trend of +0.136°C/decade.[4] MSU weighting function. Diurnal sampling. Satellite temperature measurements. Comparison of ground based measurements of surface temperature (blue) and satellite based records of mid-tropospheric temperature (red: UAH; green: RSS) since 1979.
Trends plotted since January 1982. Atmospheric temperature trends from 1979-2013 based on satellite measurements; troposphere above, stratosphere below. Paleocene–Eocene Thermal Maximum. Climate change during the last 65 million years as expressed by the oxygen isotope composition of benthic foraminifera. The Paleocene-Eocene Thermal Maximum (PETM) is characterized by a brief but prominent negative excursion, attributed to rapid warming.
Note that the excursion is understated in this graph due to the smoothing of data. The PETM is characterized by extreme changes on Earth’s surface,[5] whereby global temperatures rose by about 6 °C (11 °F). This warming extended from the tropics to high latitudes and the deep ocean. The PETM is also marked by a prominent negative excursion in carbon stable isotope (δ13C) records from across the globe; more specifically, there was a large decrease in 13C/12C ratio of marine and terrestrial carbonates and of organic carbon deposited on ocean basins.[5][6][7] This carbon isotope excursion (CIE) coincided with a marked shoaling of the ocean's carbonate compensation depth. Global warming. Global mean land-ocean temperature change from 1880 to 2014, relative to the 1951–1980 mean.

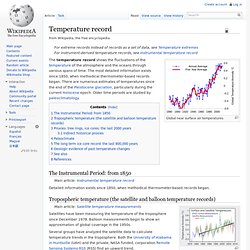
The black line is the annual mean and the red line is the 5-year running mean. The green bars show uncertainty estimates. Source: NASA GISS. Temperature record of the past 1000 years. For information on the description of the Medieval Warm Period and Little Ice Age in various IPCC reports see MWP and LIA in IPCC reports The temperature record of the past 2000 years from several different proxy methods.
Individual proxy records, such as tree ring widths and densities used in dendroclimatology, are calibrated against the instrumental record for the period of overlap. Networks of such records are used to reconstruct past temperatures for regions: tree ring proxies have been used to reconstruct Northern Hemisphere extratropical temperatures (within the tropics trees do not form rings) but are confined to land areas and are scarce in the Southern Hemisphere which is largely ocean.
Wider coverage is provided by multiproxy reconstructions, incorporating proxies such as lake sediments, ice cores and corals which are found in different regions, and using statistical methods to relate these sparser proxies to the greater numbers of tree ring records. Limitations[edit] Temperature record. For extreme records instead of records as a set of data, see Temperature extremes For instrument-derived temperature records, see Instrumental temperature record Global near surface air temperatures.
Geologic temperature record. Evidence for past temperatures[edit] Our evidence for past temperatures comes mainly from isotopic considerations (especially δ18O); the Mg/Ca ratio of foram tests, and alkenones, are also useful.
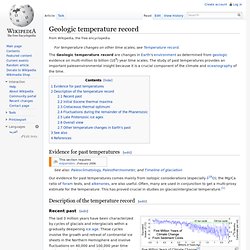
Often, many are used in conjunction to get a multi-proxy estimate for the temperature. Effects of global warming. Summary of climate change impacts.
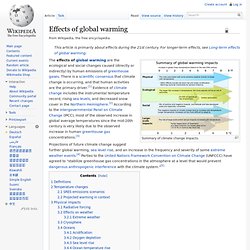
The effects of global warming are the ecological and social changes caused (directly or indirectly) by human emissions of greenhouse gases. There is a scientific consensus that climate change is occurring, and that human activities are the primary driver.[1] Evidence of climate change includes the instrumental temperature record, rising sea levels, and decreased snow cover in the Northern Hemisphere.[2] According to the Intergovernmental Panel on Climate Change (IPCC), most of the observed increase in global average temperatures since the mid-20th century is very likely due to the observed increase in human greenhouse gas concentrations.[3] Definitions Also, the term "anthropogenic forcing" refers to the influence exerted on a habitat or chemical environment by humans, as opposed to a natural process.[9]