
Speculative Gold Traders Bailing - Is It Time To Buy Gold? Latest COT report shows massive speculative long selling over the past week of over 33,000 contracts sold.
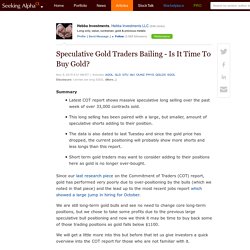
This long selling has been paired with a large, but smaller, amount of speculative shorts adding to their position. Even Light Oil is Heavy. The January Brent oil futures contract has broken down in the last 48 hours to approach its late-August lows.
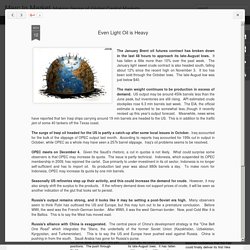
It has fallen a little more than 10% over the past week. Gold, Oil and Commodities Suffer Critical Declines, How Much More to Go? Talking Points The Bloomberg Commodity Index has dropped to a 16-year lowA range of commodities are near meaningful support, but few are as prominent as oil and goldWeak economic growth forecasts, a strong dollar and an expected rebound in yields are contributing See how retail traders are positioning in the majors in your charts using the FXCM SSI snapshot.

Among a range of asset classes with an innate sensitivity to ‘risk appetite – whether directly or otherwise – the worst performer is commodities. Lacking for income-type returns, priced against a strengthening currency and facing disappointing forecasts for global economic activity; there is significant fundamental wind working against the market. Have Commodities Reached An Inflection Point? Have Commodities Reached An Inflection Point?
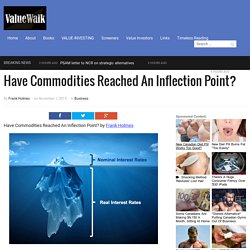
By Frank Holmes This week the Federal Reserve announced that it would delay the interest rate liftoff yet again, but while everyone seems concerned about nominal rates—the federal funds rate, in this case—real rates have already risen about 5 percent since August 2011. This “invisible” rate hike is much more impactful to commodity prices and emerging markets than a nominal rate hike, which is simply the “tip of the iceberg.” Since July 2014, the U.S. dollar has appreciated more than 20 percent. The real reason the copper price is being crushed. Kenneth Hoffman Bloomberg Intelligence: At the end of the day price is the final arbiter The turmoil on Chinese share and currency markets, and worries about the true extent of the country's economic slowdown continue to rattle investors.
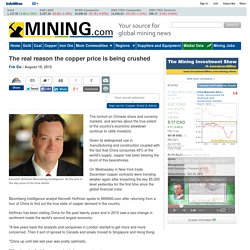
Given its widespread use in manufacturing and construction coupled with the fact that China consumes 45% of the world's supply, copper has been bearing the brunt of this bearishness. On Wednesday in New York trade December copper contracts were trending weaker again after breaching the key $5,000 level yesterday for the first time since the global financial crisis. Bloomberg Intelligence analyst Kenneth Hoffman spoke to MINING.com after returning from a tour of China to find out the true state of copper demand in the country. Hoffman has been visiting China for the past twenty years and in 2015 saw a sea-change in sentiment inside the world's second largest economy: Min Zeng sur Twitter : "Hopes of further stimulus from #China energized global stocks and sapped demand for US government bonds. via @WSJ" WSJ Markets sur Twitter : "Oil futures signal weak prices could last years via @WSJ... "Something Has To Give": Wall Street Finally Noticed The Epic Divergence Between Stocks And Commodities.
The End Of The Supercycle? Commodity "Capitulation" Arrives. In a note by BofA's Michael Hartnett titled "When Supercycles end", the bank looks at the latest EPFR fund flows and concludes that the wave of commodity "capitulation" revulsion selling has finally arrived.
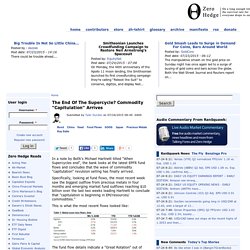
Specifically, looking at fund flows, the most recent week saw the biggest outflow from precious metals in four months and emerging market fund outflows reaching $10 billion over the last two weeks leading Hartnett to conclude that "capitulation is beginning in EM/resources/ commodities. " This is what the most recent flows looked like: The fund flow details indicate a "Great Rotation" out of commodities, Emerging Markets and, curiously, the US, and into bonds and continued flows into Europe, which has now seen 10 straight weeks of inflows with the latest one of $6.0 billion also the largest in the past 4 months.
Inflows into fixed income have been across the board: While in equities it has been a tale of two flow directions: out of the US and into Europe (and to a lesser extent Japan): Gold Panic——-What’s Going on? Early on Monday in Asian trading, someone (or something, like a trading algorithm) sold quite a bit of gold in the futures market.

Apparently the sale was so overwhelming that circuit breakers were triggered twice. Someone seems to have developed an odd predilection for selling a lot of gold futures at precisely those times when futures market liquidity is at its thinnest – as the same thing happened again after the close of official COMEX trading on Monday, in what is nomally a “quiet period”. There are many ways in which such a seemingly strange trade (which ensures one doesn’t get the best price) can potentially pay off. Nimbus.everhelper.
Pardon the interruption.
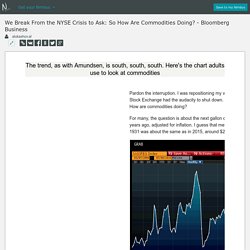
I was repositioning my vast equity holdings when the New York Stock Exchange had the audacity to shut down. So I glanced at pork bellies and wondered: How are commodities doing? For many, the question is about the next gallon of gas. Petrol cost $1.46 per gallon some 20 years ago, adjusted for inflation. I guess that means it is rich now, at about $2.70.
We Break From the NYSE Crisis to Ask: So How Are Commodities Doing? Pardon the interruption.
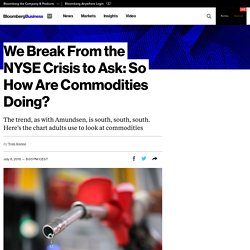
I was repositioning my vast equity holdings when the New York Stock Exchange had the audacity to shut down. So I glanced at pork bellies and wondered: How are commodities doing? For many, the question is about the next gallon of gas. Petrol cost $1.46 per gallon some 20 years ago, adjusted for inflation. I guess that means it is rich now, at about $2.70. FT Explainer: Oil re-enters bear market. Il re-entered a bear market on Tuesday extending the previous day’s losses, when Brent crude — the international benchmark — recorded its biggest one-day sell-off since February.
After dropping more than 6 per cent on Monday, Brent fell a further 2 per cent in the next trading session to $55.40 a barrel. It is down more than a fifth from its year-high of $69.63 a barrel reached during intraday trading in May. US oil production picking at OPEC's problems. Is the crude price war over? The price war in crude oil is over if you want it to be! At least that is the talk in the energy complex where Saudi Arabia declared a price war against the shale producers at the November OPEC meeting. That day and the day after I wrote that that the Saudis declared a price war and they did not cut production, but instead decided to pump even more oil in an effort to break the back of the shale producers.
Of course, now many agree that was exactly what they did. Even Saudi Arabia acknowledged it and even declared victory. The Financial Times quoted a Saudi Official as saying, "There is no doubt about it, the price fall of the last several months has deterred investors away from expensive oil including U.S. shale, deep offshore and heavy oils. " Peak Oil Optimism. Speculative bets on rising Brent crude oil prices reached a new record last week but under the surface futures and options market positioning among managed money accounts is flashing a very red warning signal... As Saxobank's Ole Hanson notes, the long/short ratio has reached 6.4 meaning that for each lot of shorts more than 6 lots are long. Historically, this looks extreme and on three previous occasions since early 2013 a reading above 6 subsequently triggered sell-offs of which the most recent was last June when the price peaked at $115.
While the focus remains on geopolitical worries the speculative data are pointing to an increased risk of a setback. A gross long of 322 million barrels only requires a small change in the fundamental or technical picture to turn into a rout. Shortly after this note, it appears Goldman also sees the same thing... Trade accordingly. Your rating: None Average: 4.5 (4 votes) SoberLook.com sur Twitter : "Chart: Bund yields grinding higher -...
Key Signals That Oil Prices Are On The Up. Submitted by Nick Cunningham via OilPrice.com, Oil prices are showing some signs of life as key indicators start pointing in a bullish direction. One of the big indicators to watch that will determine which way oil prices are heading is the rate at which oil producers are storing oil. As U.S. shale production surged in recent years, and demand began to slow, oil was increasingly diverted into storage. The U.S. saw oil stockpiles explode to their highest level since at least World War II over the last six months. The big question is when demand will sufficiently pick up and/or supply will sufficiently decrease so that those inventories stop rising. Three Hurricanes Are Headed Our Way (And There's Nowhere To Hide) Submitted by Jim Quinn via The Burning Platform blog, There are three financial hurricanes hurtling towards our country and most people are oblivious to the coming catastrophe.
The time to prepare is now, not when the hurricane warnings are issued. Hussman makes his usual solid case that stocks and bonds are as overvalued as they have ever been in the history of investing. We Are Witnessing A Fundamental Change In The Oil Sector. The U.S. oil production decline has begun. It is not because of decreased rig count. It is because cash flow at current oil prices is too low to complete most wells being drilled. The implications are profound.
Production will decline by several hundred thousand barrels per day before the effect of reduced rig count is fully seen. Unless oil prices rebound above $75 or $85 per barrel, the rig count won’t matter because there will not be enough money to complete more wells than are being completed today. Tight oil production in the Eagle Ford, Bakken and Permian basin plays declined approximately 111,000 barrels of oil per day in January.
What 100 years of commodity prices tells us about the future. Commodity prices are very persistent. Could Low Oil Prices Really Kill the U.S. Fracking Industry? U.S. shale drilling has fallen off a cliff since it became apparent that oil prices weren't going to recover quickly near the end of 2014. Iran Nuclear Deal Seen Cutting Oil Prices by $15 a Barrel. Oil prices could tumble $15 a barrel next year if sanctions are lifted following a final nuclear deal with Iran, according to the Energy Information Administration. Iran and world powers reached a preliminary agreement on April 2 that set the parameters for further negotiations needed to complete an agreement by a June 30 deadline.
Why The Oil Price Collapse Is U.S. Shale’s Fault. Yves here. Notice how Arthur Berman links overproduction of expensive oil and shale gas to access to cheap financing. In other words, the shale gas boom and bust in in large measure a by-product of ZIRP and QE. By Arthur Berman, a petroleum geologist with 36 years of oil and gas industry experience. He is an expert on U.S. shale plays and is currently consulting for several E&P companies and capital groups in the energy sector. Berman is an associate editor of the American Association of Petroleum Geologists Bulletin, and was a managing editor and frequent contributor to theoildrum.com.
Flood of global oil hints at more weakness in energy markets. Global oil supplies show few signs of ebbing, as producers from OPEC to Canada keep pumping crude despite months of sinking prices. What’s Wrong With Silver? The "strong" correlation between USD and US stocks. “There’s no place like home. There’s no place like home.
"The Risks Are Very High" Swiss Billionaire Warns "Global Financial Markets Have Never Been This Distorted Before" Submitted by Frank Suess via Acting Man blog, Risks and Opportunities Investors started off 2015 with a slow global economy, low oil prices, a strong Dollar, and a deflationary Europe with great uncertainties on the progress of the US economy and the recent launch of Europe’s quantitative easing. Too Much of Everything Spurs Commodity Exodus as Price Wars Rage. (Bloomberg) -- Investors are bailing out of commodity funds at the fastest pace on record, and the exodus shows no signs of ending. How Strong is the Relationship Between the Dollar and Commodities?
Draghi Confined by China $4 Trillion Reserves: Chart of the Day. June 10 (Bloomberg) -- European Central Bank President Mario Draghi’s plan to weaken the euro to aid exporters faces a $4 trillion challenge: how to cope with China’s efforts to diversify reserve assets, most of which are now in dollars. Here's How $20 Oil Could Become a Reality If Storage Runs Out. Here's the Next Biggest Threat to Global Crude Oil Prices - Bloomberg Business. Oil Prices Fall Amid Record Inventories. Oil Refineries Just Weeks Away Shut Downs: Edward Morse - Bloomberg Business. High-Frequency Trading Lawsuit: Algorithmic Traders Sue Other 'Flash Boys' Over 'Spoofing' Strong dollar lost US corporates $18.66 billion in Q4 2014 FiREapps report - Business Insider.
Jamie McGeever on Twitter: "Oil go where EUR go. Oil prices and the euro joined at the hip:... U.S. oil production still surging. Some Implications of the Dollar’s Rise. Peak Oil Price? Winners And Losers At The End Of The Era of The $100 Barrel - Forbes. Hot Topic - Can Stocks Rise When Dollar is Strong? Lorcan Roche Kelly sur Twitter : "Really like this chart. (note, chart nerds X, Y axes) US dollar strength yoy match Dax growth. Germany's DAX Index Is Having a Huge Year - Bloomberg Business. Why low oil prices could drag down S&P 500 - Business Insider.
Currency Trading and Intermarket Analysis: How to Profit from the Shifting Currents in Global Markets:Amazon:Books. Intermarket Analysis and Investing: Integrating Economic, Fundamental, and Technical Trends:Amazon:Books. Intermarket Technical Analysis: Trading Strategies for the Global Stock, Bond, Commodity, and Currency Markets:Amazon:Books. Intermarket Analysis: Profiting from Global Market Relationships (Wiley Trading):Amazon:Books. Why a Stronger Dollar will Lead to Deflation, Recession and Crisis. History Says Oil Is Hitting Its Long-Term Floor, Or Falling Through It - MoneyBeat. Erik Holm sur Twitter : "History says oil is hitting its long-term floor... or falling through it, says @KevinKingsbury. Intermarket analysis. Rani Molla sur Twitter : "Oil prices to stay down as U.S. oil producers get ready to unleash a new flood: by @ailworth.
U.S. Producers Ready New Oil Wave.