
Conferences.oreilly. Ggvis. Refs: package ggvis is used to turn a dataset into a visualisation, setting up default mappings between variables in the dataset and visual properties.
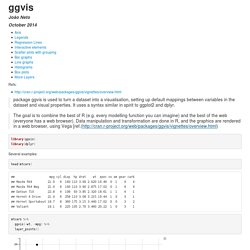
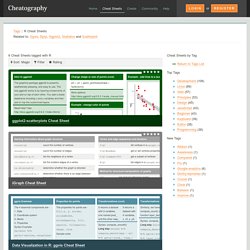
It uses a syntax similar in spirit to ggplot2 and dplyr. The goal is to combine the best of R (e.g. every modelling function you can imagine) and the best of the web (everyone has a web browser). Data manipulation and transformation are done in R, and the graphics are rendered in a web browser, using Vega [ref. Ggvis maps – Show Me Shiny. R Cheat Sheets. Show Menu Login or Register Tags :: R Cheat Sheets Related to: Ggvis, Dplyr, Ggplot2, Statistics and Scatterplot.
Teaching · Gaston Sanchez. The Comprehensive R Archive Network. R for SAS, SPSS and STATA Users.
Forecasting and Time Series Analysis. Time Series Analysis Exponential Smoothing: S = α Y t + (1-α) Yt-1 S = portion of current average + portion of previous average = smooth value Classical Equation:Forecasted Value = T x S x C FV =trend*seasonal index*cyclical index} Regression Equation:T + S + C Y = trend regression with seasonal and cyclical dummiesSeasonal Indices: AVGseason i / AVGtotal = seasonal index for season i.
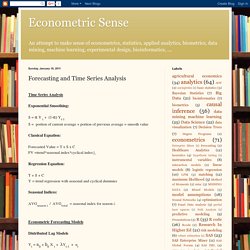
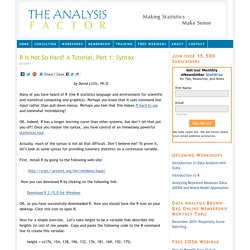
Econometric Forecasting Models Distributed Lag Models Yt = a0 + b0 X t + λYt-1 + utwhere λ is on the interval (0,1) Econometric Sense: Forecasting and Time Series Analysis. Rguide. Introduction to R - Training Material. USE R AS A CALCULATOR[edit] Use the ‘gets’ (also called the ‘assigns’) operator ( <- ) rather than the equals sign.
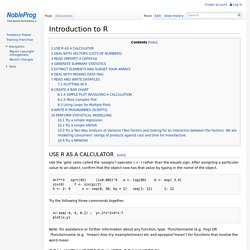
After assigning a particular value to an object, confirm that the object now has that value by typing in the name of the object. 4+7**3 sqrt(45) (1+0.005)^4 a <- log(89) b <- exp( 3.4) sin(0) f <- sin(pi/2) h <- 2: 9 x <- seq(0, 30, by = 2) seq(1: 12) 1: 12 Try the following three commands together. x<-seq(-4, 4, 0.2) ; y<-2*x^2+4*x-7 plot(x,y) Note: for assistance or further information about any function, type: ? DEAL WITH VECTORS (LISTS OF NUMBERS)[edit] Use the ‘combine’ or ‘concatenate’ operator, c, to set up vectors and arrays (as objects), and use square brackets and subscripts to identify and extract elements. == (equal to) !
Also note the logical operators: Cookbook for R. Introducción a los gráficos en R. Introducción.
Output to a file. Problem You want to save your graph(s) to a file.
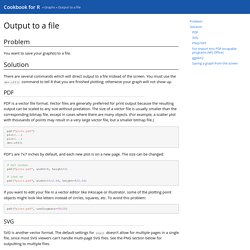
Solution There are several commands which will direct output to a file instead of the screen. You must use the dev.off() command to tell R that you are finished plotting; otherwise your graph will not show up. PDF is a vector file format. Animation with gridSVG. Statistics with R, and open source stuff (software, data, community) R - How to save a plot as image on the disk? INTRODUCTION TO R WITH EXERCISES - Training Material. Title Introduction to R with exercises Author Yolande Tra for NobleProg Ltd.
R. R. R is Not So Hard! A Tutorial, Part 1: Syntax. By David Lillis, Ph.D.
OpenIntro. OpenIntro. OpenIntro was started with one goal in mind: create a free and open-source introductory textbook.
The mission of OpenIntro is to make educational products that are free, transparent, and lower barriers to education. David Partner Chris. Gaston Sanchez. DEVELOPMENT Versions. Note that this page is only for you if You have not installed R and want to see how the HTML version of R builtin documentation looks like or have installed R, but want to find out if the not yet released versions have changed documentation.
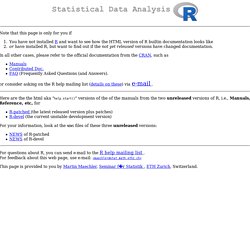
In all other cases, please refer to the official documentation from the CRAN, such as or consider asking on the R help mailing list (details on these) via e-mail . Here are the the html aka "help.start()" versions of the of the manuals from the two unreleased versions of R, i.e., Manuals, Reference, etc, for. Jumanbar/Curso-R. Davood Astaraky. Introduction to Scientific Programming and Simulation Using R-Chapman & Hall_CRC (2014) Materials of A. Shipunov. Index of /shipunov/school/biol_240. KellyBlack/R-Object-Oriented-Programming. KellyBlack/R-Object-Oriented-Programming. RPubs. RStudio lets you harness the power of R Markdown to create documents that weave together your writing and the output of your R code. And now, with RPubs, you can publish those documents on the web with the click of a button! Prerequisites You'll need R itself, RStudio (v0.96.230 or later), and the knitr package (v0.5 or later).
Instructions In RStudio, create a new R Markdown document by choosing File | New | R Markdown.Click the Knit HTML button in the doc toolbar to preview your document.In the preview window, click the Publish button. If you have questions or feedback about RPubs, drop by the RStudio support forums and let us know. Rcpp. Sometimes R code just isn’t fast enough. You’ve used profiling to figure out where your bottlenecks are, and you’ve done everything you can in R, but your code still isn’t fast enough.
In this chapter you’ll learn how to improve performance by rewriting key functions in C++. This magic comes by way of the Rcpp package, a fantastic tool written by Dirk Eddelbuettel and Romain Francois (with key contributions by Doug Bates, John Chambers, and JJ Allaire). Data Analysis in R using data.table. Data.table novice Create and subset a data.table In this lesson we will learn the ins and outs of working with the data.table package. In the first example I will demonstrate how to create integer columns and subseting using data.table. library("data.table") # To create the first data.table with two columns my_first_data_table <-data.table(x = c("a","b","c","d","e"), y = c(1,2,3,4,5)) To create a two-column data.table DT that contains the four integers 1,2,1,2 in the first column a and the letters A,B,C,D in the second column b.
DaTa-dRiveN. Wvtu55 - Online R Interpreter. The apply family in R. Data Analysis in R using data.table. R Programming - Utilities. Useful fucntions Mathematical utilities Consider the following famous functions: abs(): calculate the absolute value.sum(): calculate the sum of all the values in a data structure.mean(): calculate the arithmetic mean.round(): Round the values to 0 decimal places by default. Try out ? Round in the console for variations of round() and ways to change the number of digits to round to. Lets assume you’ve estimated a regression model on the sales data for the past six months. Davood-Astaraky (Davood Astaraky) Woking with Dates and Times with lubridate in R.
Data Analysis in R using data.table. Data Manipulation in R with dplyr. Data Manipulation in R with dplyr. Davood Astaraky. R: The R Project for Statistical Computing. Aqueronte: R: Matrices. Este capítulo atenderá a la declaración y manejo de matrices en R. Y al igual que en el capítulo vectores, nos preguntamos ¿qué es una matriz? Pues bien, una matriz A es un arreglo rectangular de números reales de dimensiones m x n. Una respuesta más simple sería: Una variable indexada con dos índices, en otras palabras, conjuntos de vectores que se acceden a ellos mediante un par de índices. Declaración de Matrices. La forma más simple de crear una matriz en R, es mediante la función matrix(), la cual posee cinco argumentos.
A continuación, se muestra cómo crear una matriz llamada M de dimensión 3x2: R_Econometría: R. Algunos comandos de R útiles en ciencia e investigación. El primer contacto con R. Estadística. Objetivos. How to learn SAS or R by myself. Resources to help you learn and use R. Code School - Try R. Download R-3.2.2 for Windows. The R-project for statistical computing. Swirl: Learn R, in R. Exploratory Data Analysis Using R. Lesson 1: What is EDA? (1 hour) We'll start by learn about what exploratory data analysis (EDA) is and why it is important.
You'll meet the amazing instructors for the course and find out about the course structure and final project. Learn Statistics with R with our online statistics tutorials. DataScienceArsenal/r-resources.md at master · binga/DataScienceArsenal.