
This Person Does Not Exist. Imagined by a GAN (generative adversarial network) StyleGAN2 (Dec 2019) - Karras et al. and Nvidia Don't panic.

Bénin - Note de diagnostic pays - Accélérer la transformation structurelle pour une croissance inclusive. Our World in Data. Tunisie : Ooredoo fait à nouveau confiance à P.I Works pour améliorer les performances de son réseau télécoms. (Agence Ecofin) - En concurrence avec Tunisie Télécom, Orange et Lycamobile, Ooredoo Tunisie renforce ses investissements pour conserver sa place de leader du marché télécoms national.
La filiale du groupe télécoms qatari éponyme veille ainsi à une haute qualité de service, source de revenus croissants. L’opérateur de téléphonie mobile Ooredoo Tunisie a renforcé son partenariat avec la société P.I Works, spécialisée dans la fourniture de solutions de planification, de gestion et d'optimisation de réseaux mobiles, pour améliorer les performances de son réseau télécoms. A travers les nouvelles solutions technologiques qui seront implémentées sur son réseau, Ooredoo Tunisie pourra surveiller de manière exhaustive les performances de ses réseaux de base, de transport et d'accès radio sans coûts supplémentaires d’intégration et dans des délais de mise en œuvre réduits.
Data et IA en Europe : existe-t-il une réelle stratégie ? La sur-réglementation émergente tend à complexifier l'innovation par l'IA dans l'UE, plaçant celle-ci dans une position d'infériorité technologique au niveau mondial.
Voici pourquoi la coordination internationale est la meilleure option. Le socle commun - La Primaire Populaire. Menu J'agis Nos propositions.
Sandales femme fille enfant anatomiques et personnalisables. TLFi. (1) Inside the World's "Most Significant" NFT Collection. (1) Inside the World's "Most Significant" NFT Collection. (1) Starry night at the Ariane 6 launch base. Senseable City Lab. Libérez votre appareil - Libérez votre Android ! Libérez votre Android !
Bien qu'Android soit principalement composé de logiciels libres, les appareils sont généralement achetés avec quelques logiciels et services propriétaires qui restreignent l'autonomie des utilisateurs. Libérez votre appareil Android : apprenez comment reprendre le contrôle de vos données, grâce à un système d'exploitation libre et des applications libres ! Applications Libres Pour les débutants, le plus facile est de commencer par libérer ses applications. Nous vous présentons des magasins d'applications libres, ainsi que quelques applications pour les usages les plus courants, tels que l'envoi de messages, la navigation sur internet ou les jeux.
France. PFD ENG ENMI PROGRAM 2018. L'écriture de soi Michel Foucault. « L'écriture de soi », Corps écrit, no 5 : L'Autoportrait, février 1983, pp. 3-23.
Dits Ecrits tome IV texte n°329 La « série d'études » dont parle M. Digital chapters and the impact on labour fr. #8 - The behaviour book : a manual for ladies / by Miss Leslie. - Full View. Air, or wlio lives in a distant part of the town, invite her to dinner, or to pass the day, rather than to tea.
She will then be able to get home before twilight. There is in Boston a very fashionable and very distinguished lady, who, since her return from Europe, has relinquished the custom of giving large parties; and now entertains her friends by, almost every day, having two or three to dine with her, — by invitation. These dinners are charming.
Horaires - Bienvenue à La Ressource de Belleville. Note de synthèse n°31 : La technologie blockchain et ses applications sur le foncier. - Foncier & Développement. – Tune Into Forests From Around The World. Les Lutins — AFD au coeur de Noel. Krama Heritage. Platforms in agricultural value chains Policy gaps. Platforms in agricultural value chains Business Models. The African Report on Child Wellbeing 2020.pdf. The African Report on Child Wellbeing 2020.pdf. The Atlas of Sustainable Development Goals 2020. The Atlas of Sustainable Development Goals 2020 was produced by the Development Economics Data Group (DECDG) of the World Bank, in collaboration with various units across the World Bank.
The Partnership Fund for the Sustainable Development Goals (SDG Fund) provided generous financial support. The publication was prepared by a team led by Ana Florina Pirlea, Divyanshi Wadhwa, and Andrew Whitby, with editorial guidance from Matthew Welch under the management of Umar Serajuddin and the overall direction of Haishan Fu. Data visualizations were produced by Maarten Lambrechts, Yaryna Serkez, Jan Willem Tulp, and Elbert Wang.
Contributions for the SDG Atlas 2020 were received from: Chisako Fukuda, David Mariano, Mikael Ello Reventar, Jomo Tariku, and Nina Vucenik managed the communications and outreach strategy and produced promotional material. Pirlea, A. Design. Training a single AI model can emit as much carbon as five cars in their lifetimes. The artificial-intelligence industry is often compared to the oil industry: once mined and refined, data, like oil, can be a highly lucrative commodity.
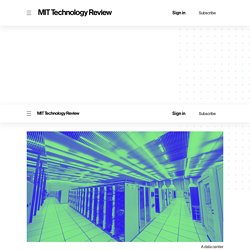
Now it seems the metaphor may extend even further. Like its fossil-fuel counterpart, the process of deep learning has an outsize environmental impact. In a new paper, researchers at the University of Massachusetts, Amherst, performed a life cycle assessment for training several common large AI models. Person holding pencil near laptop computer photo – Free Image on Unsplash. The Geopolitics of 5G. Star Wars Intro Creator. Identification for Development. Identification for Development.
Somalia’s identification ecosystem is among the least developed, both globally and within Africa ,with an estimated 12 million people in the country without an official proof of identity today.
While several functional ID systems exist, these are designed to meet specific program needs. The Role of Digital Identification in Agriculture Emerging Applications. ID Enabling Environment Assessment Guidance Note. Identification for Development. The ID4D Initiative has produced a number of resources that provide practitioners with expert guidance on the design of ID systems and tools to use during the planning process. This includes: Principles on Identification for Sustainable Development: The Principles offer a framework for the realization of inclusive and trusted digital identification systems that maximize the benefits of ID systems for sustainable development while mitigating many of the risks.
They were developed through a series of in 2017 and have now been endorsed by 25 international organizations, development partners, NGOs, and private sector associations. 912490WP0FRENC00Box385330B00PUBLIC0. DI Companies Case Study v5 WEB Singles. Identification for Development. Identification for Development. Identification for Development. Identification for Development. Global Partnership for Sustainable Development Data. SPONG – Secrétariat Permanent des ONG. The New Humanitarian. Global Partnership for Sustainable Development Data. The New Humanitarian Journalist. The New Humanitarian. «Enfants fantômes» : des parlementaires demandent davantage d’engagement de la France. La France doit renforcer son action pour aider à résoudre la question des millions d’«enfants fantômes» dans le monde, non déclarés à leur naissance et donc sans droits, réclame un rapport parlementaire présenté mardi 29 septembre.
«L’enregistrement à la naissance est le premier des droits», celui dont découlent les autres – santé, éducation, droits civiques etc. – a souligné la députée socialiste Laurence Dumont, corapporteure avec Aina Kuric (groupe Agir) de ce document mentionnant aussi les territoires français de la Guyane et de Mayotte. Quelque 166 millions d’enfants de moins de 5 ans dans le monde ne sont pas enregistrés à l’état civil et 277 millions ne disposent pas d’un acte de naissance même en cas d’enregistrement, selon des chiffres de l’Unicef cités dans le rapport. Rapport « Enfants sans identité » : adoption à l’unanimité par la commission des Affaires étrangères - Laurence Dumont. Le 22 septembre 2020, après plusieurs mois de travaux et plus de quarante auditions dont une dizaine à New-York, j’ai présenté, avec ma collègue Aina Kuric, le rapport d’information sur les « enfants sans identité » devant la commission des affaires étrangères de l’Assemblée nationale.
l15b3349 rapport information. Les « enfants fantômes » d’aujourd’hui en Afrique sont les apatrides de demain. Une phrase suffit pour installer la stupeur dans la pièce et faire taire les chuchotements. Quand Me Abdoulaye Harissou annonce que, « sans papiers, vous ne serez jamais de grands footballeurs car vous ne pourrez pas sortir du pays pour jouer dans les meilleurs clubs », des dizaines de petits yeux se figent. Dans cette annexe de mairie où se sont regroupés une soixantaine d’enfants sénégalais, l’homme poursuit, s’adressant à l’autre moitié de l’auditoire. « Vous les filles, sans acte de naissance, on peut vous marier de force précocement et vous ne pourrez pas porter plainte. » Quelques petites têtes acquiescent, façon de marquer leur conscience du sujet avant que l’orateur ne poursuive. « Un enfant a le droit et le devoir d’avoir un acte de naissance.
Sans ça, vous n’existez pas, vous êtes des enfants fantômes. » « Enfants fantômes » : des parlementaires demandent davantage d’engagement de la France. La France doit renforcer son action pour aider à résoudre la question des millions d’« enfants fantômes » dans le monde, non déclarés à leur naissance et donc sans droits, réclame un rapport parlementaire présenté mardi 29 septembre. Worldwide Mobile Data Pricing League. Using the map Countries are colour-coded by the average price of one gigabyte (1GB) of mobile data. As you can see, this paints an interesting picture, with a lot of the countries where mobile data is cheapest in and around the former USSR, and with some of the most expensive in North America, Africa and Western Europe.
Hovering over an individual country will bring up its associated data. This includes country name, its ranking out of the 228 countries measured, its cheapest available 1GB of data, its most expensive 1GB of data, how many plans were measured to create the average, and on what day the snapshot was taken.
Sans titre. Sans titre. Sans titre. Sponsored content: Thank You for the Rain, a film about a Kenyan farmer’s struggle, has helped to catalyse change nationally and internationally A documentary, which follows a struggling family fighting the impacts of climate change, has become a case study for how a film’s impact can bring about a global movement and a real change within communities. Released in 2017, Thank You for the Rain is the personal story of a Kenyan farmer’s journey from hardship to empowerment in the rapidly changing climate of his home.
When documentary filmmaker Julia Dahr approached Kisilu Musya to see if he would be interested in telling his story, he agreed, but with one condition; he wanted to shoot parts of the film himself in video-diary format. In one scene, Kisilu examines the damage done to his land after a bad storm and the camera lingers on him; “the other season we were crying, ‘no rain’… now we are talking of flood. Everything is being contradicted”. Gs OEU012v010101p. Sans titre. Cahier de la recherche processus management et carto des risques. 7foundationalprinciples. Sans titre. The use of streaming video is growing exponentially around the world. These services are associated with energy use and carbon emissions from devices, network infrastructure and data centres. Yet, contrary to a slew of recent misleading media coverage, the climate impacts of streaming video remain relatively modest, particularly compared to other activities and sectors.
You have been blocked. You have been blocked.
La blockchain, émancipation ou domination ? Primavera De Filippi est chargée de recherche au CERSA/CNRS et chercheuse associée au Berkman-Klein Center à l’Université de Harvard. Sa recherche porte sur les implications juridiques et politiques de la blockchain et des crypto-monnaies. Primavera est aussi la fondatrice de la Coalition Dynamique sur les technologies blockchain (COALA) au sein de du Forum International sur la Gouvernance d’Internet (IGF). E-Agri. Eau et assainissement. eGov. eID.
Transport. Supply chain. Education. Economie digitale. Climat. SDGs. Inclusion numérique. Genre. Sobriété numérique. Connectivité. Open Data.
IoT. Internet. Formation IT / NUM. Gestion de projet. IT. Afrique. Mali. Bénin. Cameroun. Martinique. A ranger perso.