
Robin Baker
6 excellent charting libraries for php. Charts are an indispensable part of any data visualization work.
People can grok visual representation of data easily than a textual variety. Today there are a huge number of free chart libraries available to display visualizations on websites. Below is a small list of some of the libraries available for displaying charts using php. 1. Visifire output format: Silverlight license: GPL 3.0 / Commercial Visifire is a set of open source data visualization components – powered by Microsofts Silverlight technology. Features: Visually Stunning Animated ChartsSingle API to both Silverlight & WPFEmbed into Desktop or Web Applications in minutesReal time Charts / Live UpdateTiny footprintEnterprise grade featuresMicrosoft Expression Blend compatibleDual License – Open Source & Commercial 2.
FusionCharts is a client side charting solution. Key Features: 3. PHP/SWF Charts is a simple, yet powerful PHP tool to create attractive web charts and graphs from dynamic data. Some features: One of my favorites. Online Charts Builder. Hohli Online Charts Builder Charts Hohli Donate Author Blog Load From Image URL: Chart Data can't equal to original, but very similar to it.

Only for images on chart.apis.google.com Chart Type: Lines Bar charts Pie charts For with labels choose 1000x300 or 800x375 size Venn diagrams Scatter plots Radar charts Chart Size: Horizontal 1000x300 800x375 600x500 320x240 Vertical 300x1000 375x800 500x600 240x320 Square 546x546 400x400 300x300 200x200. Data visualization. Interactive charts online! SWF Charts > Introduction. XML/SWF Charts is a simple, yet powerful tool to create attractive charts and graphs from XML data.
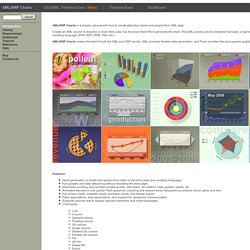
Create an XML source to describe a chart, then pass it to this tool's flash file to generate the chart. The XML source can be prepared manually, or generated dynamically using any scripting language (PHP, ASP, CFML, Perl, etc.) XML/SWF Charts makes the best of both the XML and SWF worlds. XML provides flexible data generation, and Flash provides the best graphic quality. Features: Quick generation of charts and graphs from static or dynamic data (any scripting language) Full updates and data streaming without reloading the web page.
Testimonials I just wanted to pass along how well your script worked for our stock performance page. Good work! This is amazing software. Just want to thank you for this wonderful upgrade. I purchased your product a couple days ago and first had time to sit down and work with it this morning. Wow, you are the best! Thanks for your great script. THIS ROCKS!
Getting started.