
JavaScript HTML DOM Events. Referencia de JavaScript. Objetos globales Valor de las propiedades Las propiedades globales regresan un valor simple.
Propiedades de la Función Funciones globales retornando el resultado de una rutina específica. Sentencias For an alphabetical listing see the sidebar on the left. Control flow Block A block statement is used to group zero or more statements. Break Terminates the current loop, switch, or label statement and transfers program control to the statement following the terminated statement. continue Terminates execution of the statements in the current iteration of the current or labeled loop, and continues execution of the loop with the next iteration. Empty An empty statement is used to provide no statement, although the JavaScript syntax would expect one. if...else Executes a statement if a specified condition is true. Switch Evaluates an expression, matching the expression's value to a case clause, and executes statements associated with that case. throw Throws a user-defined exception. try...catch Declarations var let.
JavaScript console - for debugging JavaScript and remote debugging mobile web apps. JavaScript. JavaScript® (a veces abreviado como JS) es un lenguaje ligero e interpretado, dialecto del estándar ECMAScript, orientado a objetos con funciones de primera clase, más conocido como el lenguaje de script para páginas web, pero también usado en muchos entornos sin navegador, tales como node.js o Apache CouchDB. Es un lenguaje script multi-paradigma, basado en prototipos, dinámico, soporta estilos de programación funcional, orientada a objetos e imperativa.
Leer más sobre JavaScript. Desde el lanzamiento en junio de 1997 del estándar ECMAScript 1, han existido las versiones 2, 3 y 5, que es la más usada actualmente (la 4 se abandonó). En junio de 2015 se cerró y publicó la versión ECMAScript 6 El estándar de JavaScript es ECMAScript. JsPerf: JavaScript performance playground. Tutorial: Debugging. This tutorial introduces you to using Google Chrome's built-in Developer Tools to interactively debug an extension.
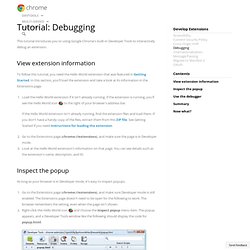
To follow this tutorial, you need the Hello World extension that was featured in Getting Started. In this section, you'll load the extension and take a look at its information in the Extensions page. Load the Hello World extension if it isn't already running. If the extension is running, you'll see the Hello World icon to the right of your browser's address bar. If the Hello World extension isn't already running, find the extension files and load them. As long as your browser is in Developer mode, it's easy to inspect popups. Go to the Extensions page ( and make sure Developer mode is still enabled. The popup remains open as long as the Developer Tools window does. In this section, you'll follow the execution of the popup page as it adds images to itself.
Use the buttons next to the play/pause button to step over, into, and out of function calls. Debugging JavaScript. This document is intended to help developers writing JavaScript code in Mozilla, mainly for Mozilla itself, but it may also be useful for web developers.
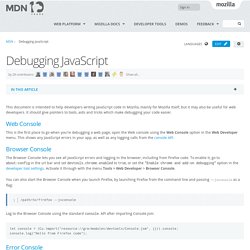
It should give pointers to tools, aids and tricks which make debugging your code easier. Web Console This is the first place to go when you're debugging a web page; open the Web console using the Web Console option in the Web Developer menu. This shows any JavaScript errors in your app, as well as any logging calls from the console API. Browser Console The Browser Console lets you see all JavaScript errors and logging in the browser, including from Firefox code. You can also start the Browser Console when you launch Firefox, by launching Firefox from the command line and passing --jsconsole as a flag: /path/to/firefox --jsconsole Log to the Browser Console using the standard console API after importing Console.jsm: let console = (Cu.import(" {})).console; console.log("Hello from Firefox code"); Error Console Browser Debugger (Built-in)
Internet Explorer Learning - F12 Developer Tools. Internet Explorer 8 fue el primer navegador en proporcionar herramientas de desarrollo integradas para ayudar a los desarrolladores en la creación rápida de prototipos, pruebas y depurar páginas Web y permitirles ver los cambios realizados por ellos, directamente en el navegador.
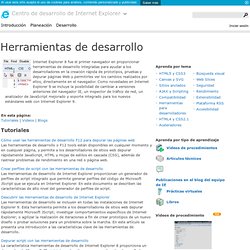
Como novedades en Internet Explorer 9 se incluye la posibilidad de cambiar a versiones anteriores del navegador IE, un inspector de tráfico de red, un analizador de JavaScript mejorado y soporte integrado para los nuevos estándares web con Internet Explorer 9. Tutoriales Volver arriba Videos Circular Memory Leak DetectionEn este vídeo, Matt Hester discute mejoras de administración de memoria de Internet Explorer que reducirá los efectos de pérdidas de memoria creados por referencias circulares entre objetos de Microsoft Jscript y Document Object Model (DOM).
JavaScript Guide - JavaScript. The JavaScript Guide shows you how to use JavaScript and gives an overview of the language. If you need exhaustive information about a language feature, have a look at the JavaScript reference. This Guide is divided into the following chapters. Introduction Grammar and types Control flow and error handling Loops and iteration Functions Expressions and operators Numbers and dates Text formatting Indexed collections Keyed collections Working with objects Details of the object model Promises Iterators and generators. JavaScriptSource.com - Free JavaScripts, Tutorials, Example Code, Reference, Resources, And Help.