
6.851: Advanced Data Structures. Data Structure Visualization. Algorithmist. ESMAJ. Katrina Ellison Geltman. Thu 20 February 2014 Simulated annealing is a method for finding a good (not necessarily perfect) solution to an optimization problem.
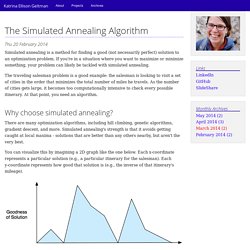
If you're in a situation where you want to maximize or minimize something, your problem can likely be tackled with simulated annealing. The traveling salesman problem is a good example: the salesman is looking to visit a set of cities in the order that minimizes the total number of miles he travels. As the number of cities gets large, it becomes too computationally intensive to check every possible itinerary.
At that point, you need an algorithm. Why choose simulated annealing? There are many optimization algorithms, including hill climbing, genetic algorithms, gradient descent, and more. You can visualize this by imagining a 2D graph like the one below. Broadly, an optimization algorithm searches for the best solution by generating a random initial solution and "exploring" the area nearby. The basic algorithm Here's a really high-level overview. Conclusion. Visualgo.net/sorting.html. VisuAlgo was conceptualised in 2011 by Dr Steven Halim as a tool to help his students better understand data structures and algorithms, by allowing them to learn the basics on their own and at their own pace.
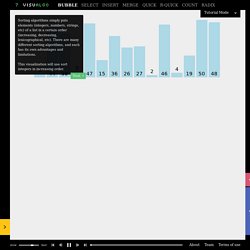
VisuAlgo contains many advanced algorithms that are discussed in Dr Steven Halim's book ('Competitive Programming', co-authored with his brother Dr Felix Halim) and beyond. Today, some of these advanced algorithms visualization/animation can only be found in VisuAlgo. Though specifically designed for NUS students taking various data structure and algorithm classes (e.g. CS1010, CS1020, CS2010, CS2020, CS3230, and CS3233), as advocators of online learning, we hope that curious minds around the world will find these visualisations useful too. VisuAlgo is not designed to work well on small touch screens (e.g. smartphones) from the outset due to the need to cater for many complex algorithm visualizations that require lots of pixels and click-and-drag gestures for interaction. Bit Twiddling Hacks.
By Sean Eron Anderson seander@cs.stanford.edu Individually, the code snippets here are in the public domain (unless otherwise noted) — feel free to use them however you please.
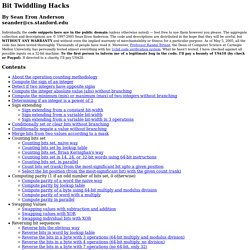
The aggregate collection and descriptions are © 1997-2005 Sean Eron Anderson. The code and descriptions are distributed in the hope that they will be useful, but WITHOUT ANY WARRANTY and without even the implied warranty of merchantability or fitness for a particular purpose. As of May 5, 2005, all the code has been tested thoroughly. Thousands of people have read it. Contents About the operation counting methodology When totaling the number of operations for algorithms here, any C operator is counted as one operation.
Compute the sign of an integer The last expression above evaluates to sign = v >> 31 for 32-bit integers. Alternatively, if you prefer the result be either -1 or +1, then use: sign = +1 | (v >> (sizeof(int) * CHAR_BIT - 1)); // if v < 0 then -1, else +1. The Algorithms Design Manual (Second Edition) - AlgoWiki. Visualizing Algorithms. The power of the unaided mind is highly overrated… The real powers come from devising external aids that enhance cognitive abilities.
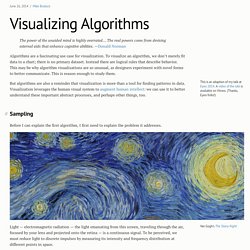
—Donald Norman Algorithms are a fascinating use case for visualization. To visualize an algorithm, we don’t merely fit data to a chart; there is no primary dataset. Instead there are logical rules that describe behavior. This may be why algorithm visualizations are so unusual, as designers experiment with novel forms to better communicate. But algorithms are also a reminder that visualization is more than a tool for finding patterns in data. #Sampling Before I can explain the first algorithm, I first need to explain the problem it addresses.
Light — electromagnetic radiation — the light emanating from this screen, traveling through the air, focused by your lens and projected onto the retina — is a continuous signal. This reduction process is called sampling, and it is essential to vision. Sampling is made difficult by competing goals. Here’s how it works: