
Envision - demos. Envision.js is a library for creating fast, dynamic and interactive HTML5 visualizations.

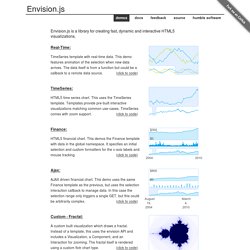
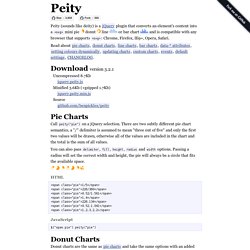
Real-Time: TimeSeries template with real-time data. This demo features animation of the selection when new data arrives. Graphs. Plot & graphic curve. jOrgChart - A jQuery OrgChart Plugin. Geolocalisation. jStat : a JavaScript statistical library. Map. Arbor.js. Progressive <canvas> pie charts. Peity (sounds like deity) is a jQuery plugin that converts an element's content into a <svg> mini pie 2/5 donut 5,2,3 line 5,3,9,6,5,9,7,3,5,2 or bar chart 5,3,9,6,5,9,7,3,5,2 and is compatible with any browser that supports <svg>: Chrome, Firefox, IE9+, Opera, Safari.

Download version 3.2.1 Uncompressed 8.7Kb jquery.peity.js Minified 3.6Kb (+gzipped 1.7Kb) jquery.peity.min.js.