
DataViz. Www.perceptualedge.com/articles/b-eye/choosing_colors.pdf. Transparency.jpg (2560×1440) Discussing ‘Are the richest American’s also the best educated?’ On Twitter over the weekend, a number of visualisation grandees (Mortiz Stefaner, Andrew Vande Moere, Robert Kosara, Enrico Bertini and Noah Iliinsky) have been discussing and debating the rights and wrongs of a particularly unusual chloropleth map published in Good magazine.
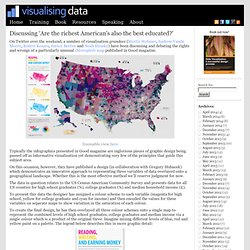
Zoomable view here Typically the infographics presented in Good magazine are inglorious pieces of graphic design being passed off as informative visualisation yet demonstrating very few of the principles that guide this subject area. On this occasion, however, they have published a design (in collaboration with Gregory Hubacek) which demonstrates an innovative approach to representing three variables of data overlayed onto a geographical landscape. Whether this is the most effective method we’ll reserve judgment for now. The data in question relates to the US Census American Community Survey and presents data for all US counties for high school graduates (%), college graduates (%) and median household income (£). Coral app. ConceptNet Graphs. ConceptNet Graphs A NodeBox code library that graphs data from ConceptNet, a commonsense knowledgebase and natural-language-processing toolkit written in Python.
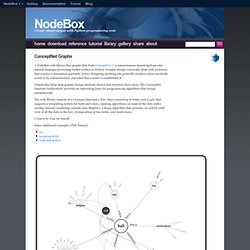
Graphic design commonly deals with problems that require a conceptual approach: before designing anything one generally wonders what essentially needs to be communicated, and what that essence is constituted of. Graphs like these help graphic design students dissect and structure their ideas. The ConceptNet database furthermore provides an interesting basis for programming algorithms that design autonomously.
The code library consists of a Concepts class and a Tree class (consisting of Nodes and Leafs) that supports a templating system for fonts and colors, roaming algorithms (so none of the data nodes overlap, thereby rendering valuable data illegible), a dump algorithm that provides an orderly table view of all the data in the tree, juxtaposition of two nodes, and much more. Created by Tom De Smedt. Coral - procedural effects software. NumericAndScientific/Plotting. Over the years many different plotting modules and packages have been developed for Python.
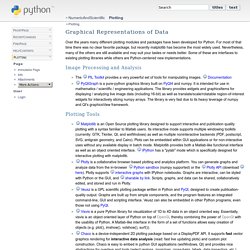
For most of that time there was no clear favorite package, but recently matplotlib has become the most widely used. Nevertheless, many of the others are still available and may suit your tastes or needs better. Some of these are interfaces to existing plotting libraries while others are Python-centered new implementations. Matplotlib is an Open Source plotting library designed to support interactive and publication quality plotting with a syntax familiar to Matlab users.
Its interactive mode supports multiple windowing toolkits (currently: GTK, Tkinter, Qt, and wxWindows) as well as multiple noninteractive backends (PDF, postscript, SVG, antigrain geometry, and Cairo). NodeBox 2. Home. Matplotlib: python plotting. Android или iOS: как собрать офис в своем смартфоне - Газета.Ru.
Нынешнее поколение мобильных телефонов — это не просто «трубки», по которым можно разговаривать.
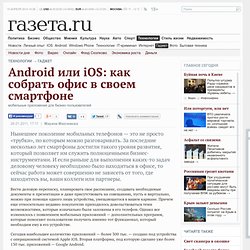
За последние несколько лет смартфоны достигли такого уровня развития, который позволяет им служить полноценными бизнес-инструментами. И если раньше для выполнения каких-то задач деловому человеку необходимо было находиться в офисе, то сейчас работа может совершенно не зависеть от того, где находитесь вы, ваши коллеги или партнеры. Вести деловую переписку, планировать свое расписание, создавать необходимые документы и презентации и даже присутствовать на совещаниях, пусть и виртуально, можно при помощи одного лишь устройства, умещающегося в вашем кармане.
Причем еще относительно недавно покупателю приходилось довольствоваться теми возможностями, которые изначально были заложены в его телефон. Однако все изменилось с появлением мобильных приложений — дополнительных программ, которые помогают пользователю получить именно тот функционал, который необходим ему в его устройстве. Новости и сводки. 5pm - project management on time. Tour. Project Management Software Online: Project Manager.com.