
Polynomials - Lesson 2. Teach Me How To Factor (WSHS Math Rap Song) Mr. E. The number bender. Angry Birds Geogebra. Angry Birds is a pretty popular game with the kids nowadays.

My students brought up the game when we started talking about parabolas and I've been working on a way to bring that connection into a class. So, I created a lesson using GeoGebra and some screenshots from Angry Birds mixed in with some inspiration from Dan'sWill The Ball Hit The Can? I created 4 GeoGebra files each with a piece of a different Angry birds shot like so: Using GeoGebra, students worked in groups of 2 on their laptops to place points onto the bird's trail as accurately as possible to create a quadratic models in order to decide if the bird would score a direct hit on any of the pigs.
If you had 4 points labeled A-D, for instance, the GeoGebra command Some commands that helped them place their points accurately: CTRL= Zooms in CTRL- Zooms out CTRL CLICK DRAG Pans your view Once students finished their files would look something similar to the file shown here: Angry Birds - Activities - Teach Maths. 'Take aim and shoot those naughty pigs!

' The pigs have stolen the birds’ eggs. That makes them angry, very angry. They take aim and launch themselves towards the pigs to get their revenge and reclaim their babies. Based on the classic angry birds game you will be guiding the birds to ensure that their aim is good. Enter the correct quadratic equation and birds fly on the right path and knock out the pigs. Modeling with Angry Birds: Where will it land? « mcdoteaching. This is a fantastic activity that students just love.

With over 250 million downloads, they all know the game and it’s a great way to apply their knowledge of quadratics to a familiar and fun setting. Although I wish I could, I can’t take full credit for this idea having originally learned about it through reading other blogs. Almost immediately after hearing about it I did a Google image search for screen shots that would work for this activity but had no luck.
What you need for this are two screen shots: one of the bird mid-flight (half of the parabolic path it travels), and one of the completed path traveled. Mr. Orr is a Geek.com » Angry Birds – Parabolas. Students design their own Angry Birds level.

Practice Worksheets/Graphs and Statistics/FREQUENCY_HISTOGRAMS_BAR_GRAPHS_AND_TABLES_IA.pdf. Using Recursion to Explore Real-World Problems. Gapminder: Unveiling the beauty of statistics for a fact based world view. - Gapminder.org. Drag and Drops. Arithmetic Sequences (with videos, worksheets, games. Free educational learning basic math videos- Introduction to function notation and interval notation. Introduction to Functions. Algebra II Lesson 2.1 "Introduction to Functions" Tutorial.
Introduction to Linear Functions - MathOps. Introduction to functions. 1.6 - Lesson - Introduction to Functions Video Lesson. Introduction to Functions Gizmo. Introduction to Functions. Linear Functions in Action. Introduction to Functions. There are many algebra books that have many ways of defining a function.

Chances are if you look at four different books you would find at least two different explanations of a function. Does this mean some explanations are right and others are wrong or that there are numerous definitions for a function? Not really. The definition of a function never changes, but the way teachers and textbooks explain that definition take on many forms. Algebra 1 Unit 2 Linear Functions.
Domain and Range of a Function. Ride the Line...A Game for Parallel & Perpendicular. Last week we were investigating linear equations....in particular what parallel and perpendicular lines look like as equations, not just graphs.
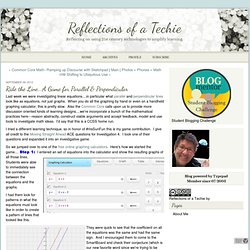
When you do all the graphing by hand or even on a handheld graphing calculator, this is pretty slow. Also the Common Core calls upon us to provide more discussion oriented kinds of learning designs....we're incorporate a bunch of the mathematical practices here---reason abstractly, construct viable arguments and accept feedback, model and use tools to investigate math ideas.
I'd say that this is a CCSS home run. I tried a different learning technique, so in honor of #msSunFun this is my game contribution. I give all credit to the Moving Straight Ahead ACE questions for Investigation 4. So we jumped over to one of the free online graphing calculators. Into the calculator and show the resulting graphs of all those lines.
I had them look for patterns in what the equations must look like in order to create a pattern of lines that looked like this. Explore Lessons. Explorequadratics. Brain-Cells GCSE Revision - 2. Regions on Graph. An unusual way to teach plotting straight line graphs… Image via Wikipedia I bet you’ve not seen this one before… After putting across the idea of the relationship, and motivating the pupils by explaining how the next time they are out and about in the countryside and want to know what the temperature is they can work it out by listening to crickets, give them this worksheet which gets them plotting the linear relationship between degrees fahrenheit and chirps per minute.

The worksheet is quite scaffolded and I took some artistic (mathematician’s) license to adjust the coefficients of the equation so that it was more appropriate for secondary school pupils to work with. After working out their table of values and plotting the straight line graph they are given questions that assess their ability to interpret the graph.