
30+ Mind Mapping Tools. We all need to organize our thoughts sometimes, and there seems to be no better way to do it than in a visual fashion.
We've got 30+ mind mapping tools to help you do just that. And since we know some of you are on a budget, we've got free and paid suggestions for you. Don’t forget to check out our post where you can suggest future toolbox topics! (This list, for example, came from one of the suggestions.) Free Bubbl.us - A flash based brainstorming tool that you can share with others and also embed in to your site. Cayra.net - A desktop-only app that runs on Windows XP or Vista. CmapTools - Free to universities, students, federal employees, and individuals for personal use. CompendiumInstitute.org - A free mind mapping and brainstorming tool from the Open University. DebateMapper.com - A bit of a different mapper in that it focuses on mapping out debates, whether they be political or business. Gliffy.com - Draw & share all sorts of diagrams and mind maps.
3d Mind Mapping, 3d Mind Maps, 3d Concept Maps. Mind mapping 3D. 3d mind mapping software. Mindmapping, concept mapping in 3D. Mindmapping, concept mapping and information organisation software. Spatial Analysis. TreeMap interactive visualization tool by Macrofocus. Browsing data sets. Here are the most recent data sets uploaded to Many Eyes.
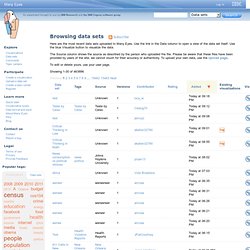
Use the link in the Data column to open a view of the data set itself. Use the blue Visualize button to visualize the data. The Source column shows the source as described by the person who uploaded the file. Please be aware that these files have been provided by users of the site; we cannot vouch for their accuracy or authenticity. To upload your own data, use the Upload page. To edit or delete yours, use your user page.
Showing 1-30 of 463886 Previous123456789…1546215463Next. TULP interactive. See the final version here. This is an example of Conway’s Game of Life, built in D3. According to Wikipedia: The Game of Life, also known simply as Life, is a cellular automaton devised by the British mathematician John Horton Conway in 1970.[1]The “game” is a zero-player game, meaning that its evolution is determined by its initial state, requiring no further input. One interacts with the Game of Life by creating an initial configuration and observing how it evolves. There are only 4 rules in the Game of Life: The universe of the Game of Life is an infinite two-dimensional orthogonal grid of square cells, each of which is in one of two possible states, live or dead.
The initial pattern constitutes the seed of the system. I’m sure there are multiple ways of implementing Conway’s Game of Life, but this is just one of them. The states variable will be used to hold the states of each cell: true for on and false for off. Now we initialize the visualization: That’s all there’s to it. Documentation. Learn the basics of D3 with this introductory tutorial, covering the core concepts of selections and data binding.
Read me first! Using the example of a no-frills, static bar chart, this guide describes the core D3 concepts, including selections, functional properties, and scales. You'll also see how D3 can be applied to HTML, CSS and SVG. A continuation of the above introductory tutorial, this guide covers more exciting dynamic aspects of D3, including transitions and data joins. Learn how to create realtime visualizations and specify enter and exit animations. An introduction to D3 for users of Protovis. Data Visualizations. Cause of Death trends for the United States and Australia, 1970-2006 One way to measure the success of a country's health system is to analyze the probability that a 15-year-old in that country will die before reaching age 60 if mortality trends in that country remained the same.

Progress in maternal and child mortality by country, age, and year (Global), 1990-2011 With four years left for countries to achieve international targets for saving the lives of mothers and children, more than half the countries around the world are lowering maternal mortality and child mortality at an accelerated rate. Breast and cervical cancer incidence and mortality by age, region, and country (Global), 1980-2010 With this interactive tool, explore trends in breast and cervical cancer for women (aged 15-79) and reproductive age women (aged 15-49) for 187 countries between 1980 and 2010. Life expectancy by county, sex, and race (US), 1987-2007 Diabetes prevalence by county (US) maps. Data Visualizations, Challenges, Community. Find Data. Health & Disease Maps. Visual Thinking. OS GIS. Fractals. InfoGraphics (Visual Maps)