

Palladio Palladio is a toolset for easy upload and careful investigation of data. It is an intertwined set of visualizations designed for complex, multi-dimensional data. It is a product of the "Networks in History" project that has its roots in another humanities research project based at Stanford: Mapping the Republic of Letters (MRofL). With "Networks in History" we are taking the insights gained and lessons learned from MRofL and applying them to a set of visualizations that reflect humanistic thinking about data. Palladio is made possible by support from the Office of Digital Humanities within the National Endowment for the Humanities, the Vice Provost for Online Education at Stanford, the Wallenberg Foundation, the Stanford University Libraries, and the Dean of Research at Stanford.
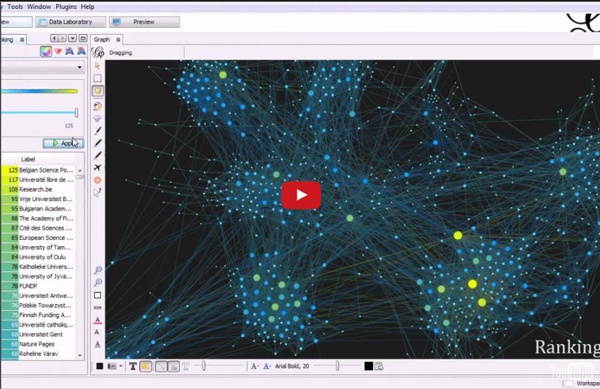
Gephi, an open source graph visualization and manipulation software What is the Spatial Turn? · Spatial Humanities “Landscape turns” and “spatial turns” are referred to throughout the academic disciplines, often with reference to GIS and the neogeography revolution that puts mapping within the grasp of every high-school student. By “turning” we propose a backwards glance at the reasons why travelers from so many disciplines came to be here, fixated upon landscape, together. For the broader questions of landscape – worldview, palimpsest, the commons and community, panopticism and territoriality — are older than GIS, their stories rooted in the foundations of the modern disciplines. These terms have their origin in a historic conversation about land use and agency. Read the Introduction. About the Author Dr.
Gallery Introduction At the beginning of the fall semester, I showed up to my Thursday night Business Law class ready to soak up all the information that was going to allow me to do well in the course. I’m a ‘laptop student’, so usually once the teacher starts talking, I’m go go go, typing away until the lecture is over. The end result is ten pages of notes that I think will be useful once midterm and final exam times come. Choosing VUE So sticking to my ‘inquiring green’ personality type, I set off on a quest to find a better way to maximize my knowledge absorption from the lecture. Overcoming Linear Boundaries With VUE I was able to get more out of the lecture for some very basic reasons. Secondly, unlike most word processing programs, the non-linear setup of VUE allowed me to connect and relate concepts that may not have fallen in the same chronological point of the lecture. So is concept mapping software the saving grace for every student hoping to get the most out of a lecture?
Exploring Big Historical Data: The Historian's Macroscope Welcome to the companion site for Exploring Big Historical Data: The Historian’s Macroscope, published by Imperial College Press. If you want to buy a copy, you can purchase one for $39.00 USD. Feel free to visit our original live-written fully open draft website, which is still online – and if you like what you see, you can always buy the book! On this site you will find code, essays (things we liked from the draft that did not fit), and datafiles that go with our book. •Diversity is vital to digital history, and our readers should consider it an essential additional chapter. Illustrations in the print book are in black-and-white. If you want clickable footnotes (which you probably do!) If you’re curious who we are, you can learn more about us here. Please explore our website, and if you have questions, get in touch or check out the wonderful DH Questions & Answers Site!
Architecture Freeplane is a Java Swing application that has two major variants: Standalone desktop application (full functionality) This is the application most people know. The distribution contains also a Portable version of the desktop application. It's just a different style of packaging the application to make it portable on USB sticks etc. but it's not another application. Browser applet (limited functionality) The desktop application architecture is based on the OSGi framework. The fact that Freeplane is build on OSGi has the following consequences: All of Freeplane's components are packaged as OSGi bundles (aka "plugins"). We use Eclipse as development enviroment with OSGi support. The browser applet does not use functionality contributed by the plug-ins. Projects All major components have their own project (toplevel directory in the version control system and an Eclipse project) and they are build into separate JARs. $ cd "/Program Files/Freeplane" $ find . Startup sequence Overview
First steps | Historical Network Research 1) Start with some introductory texts on Social Network Analysis Among the general HNR articles in the Bibliography, Scott Weingart’s blog post series “Networks Demystified” and Claire Lemercier’s article “Formal network methods in history” are particularly useful to get you ideas. To get a first idea of Social Network Analysis terminology and concepts, you may find this Cheat Sheet helpful. A great resource which will help you understand what you can expect from Social Network Analysis is Valdis Krebs’ Network Discovery Matrix. 2) Find answers to these questions: 1. The “Should I do Social Network Analysis?” If you are already working with network visualisations, take a look at Yannick Rochat’s blog post on best practices: 209983CAZ4EFH4items1chicago-fullnote-bibliographydefau
Scientific Collaboration Networks According to Antonio Perianes-Rodriguez and from the perspective of Library Science and Documentation, little research has yet been conducted on scientific networking and its possible uses in ascertaining the composition of research groups, the differences in associations between specialities or departments, and the different policies that may be followed in this regard, depending on the institution or the domain analyzed. Traditionally, most studies on scientific collaboration have been geared to analyzing output, be it international or domestic, of a given scientific discipline or a research institution. Studies on smaller units such as departments or research groups are however less common.
MapAnalyst