
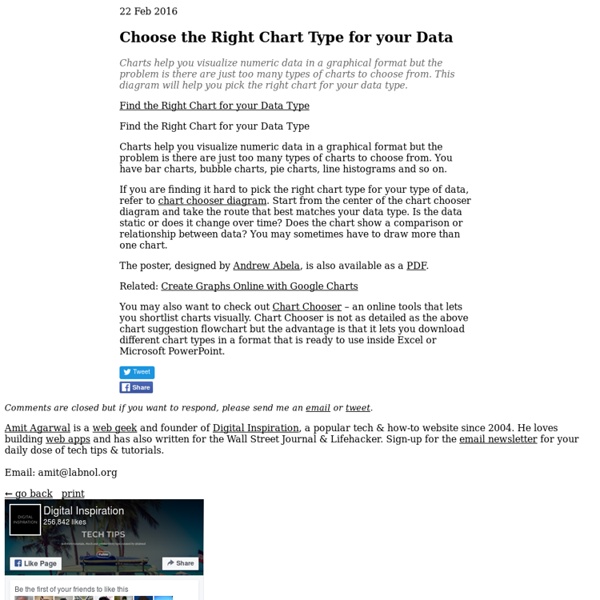
Butterfly Chart – Excel Chart with Dual Converging Scales A Butterfly chart is a chart where two entities are compared side by side using scales meeting at the center. Due to its shape, the chart resembles a butterfly and hence the name. These charts are sometimes also known as Funnel or Tornado Charts though I find “butterfly” to be a better description as it allows for a greater variation in shape than a funnel or a tornado does ! So let’s jump straight into creating a beautiful looking butterfly chart. Getting the Data for the chart Although a simple looking butterfly chart is as easy to create as a bar chart, there is some value in adding labels, converging scales and the other embellishments. The first three columns essentially contain all the data related to the business. Making the basic Chart Let’s create a basic chart with five series. Adding the XY series for the dummy scales Once we’ve inserted the XY-Series the chart looks like this: Aligning the XY points to the X axis If you noticed, the points are not aligned to the X-Axis.
How to: Comment faire un Google Motion Chart Google Motion Chart est un outil puissant et simple d'utilisation qui permet d'interroger facilement un grand nombre de points de données. Voici en quelques étapes simples comment réaliser le sien. Faire parler des tableaux de données, c’est pas facile. On peut les décrire à la main, mais c’est long et fastidieux. On peut en faire des visualisations, mais ça coûte cher en design. Il existe une solution idéale, le Google Motion Chart, inspiré de GapMinder. OWNI l’a testé pour expliquer les causes de la crise grecque. Tutoriel par l’exemple : Tentons d’expliquer pourquoi un pays émet du CO2. 1. Trouvez une base de données. Sélectionnez les séries de données qui vous paraissent pertinentes. 2. Pour pouvoir travailler proprement, il disposer de données homogènes. On va ici se limiter à analyser les 27 pays de l’UE de 1990 à 2007. Les onglets AI et CA donnent accès à des données plus détaillées. 3. Mettez à jour le tableau et exportez. Exportez dans Microsoft Excel. 4. Retournez sous Excel. 5.
The Daily Graph "The Daily Graph" re-creates charts from The Economist's Graphic Detail blog using standard run-of-the-mill Excel techniques without macros. We do try to milk Excel for all it's worth and apply techniques that may not have been intended in the way we use them. In the end, it's the result that counts. "The Daily Graph" is published whenever we spot an interesting chart on The Economists's blog that looks like it cannot be done in Excel. Typically once or twice a week if we can find the time.The Daily Graph blog comes with a dowloadable version of an Excel workbook so that you can follow what we did... or you can "borrow" our work and use it for something entirely different. "The Economist" is a trademark of The Economist Newspaper Limited.
The World Top Incomes Database How to Create a Panel Chart in Excel To show a concise, clear summary of data for several departments or cities, you can create a panel chart in Excel. It shows all the data in a single chart, with vertical lines separating the groups. My chart shows sales for bars and cookies, in four cities, over the first 7 months of the current year. I learned this technique from Jon Peltier's website, where he also sells a Panel Chart Utility, that creates dot plot and bar panel charts. Panel Chart Steps The instructions for making a panel chart look long and complicated, and I've avoided learning this technique, because it was a daunting process. Last week, I finally took the plunge, and it's not so bad, once you get the big picture in your head. Add a separator field to the source data Summarize the data in a pivot table Copy the pivot table data as values Create a line chart from the copied data Add another series to create vertical dividing lines Add final formatting to clean up the chart Add a separator field Summarize the data
Climat Cosmograph in Excel - World migration with bilateral flow chart - E90E50fx Igor: What is this?Freddy: Schwarzwalder KirschtorteMonster (OS): MmmFreddy: Oh, do you like it? I'm not partial to desserts myself, but this is excellentIgor: Who are you talking to?Freddy: To you. You just made a yummy sound, so I thought you liked the dessertIgor: I didn't make a yummy sound. Monster (OS): Mmm. by The FrankensTeam Initially I was inspired byPeoplemovinCarlo Zapponi's chart. It is a very nice job that I wanted to reproduce in Excel ...and I created a file but did not get a satisfactory result (if you want I can send the file) ... sometimes we have to know how to lose ... or maybe we just need to change strategy. I had to fix the formulas in values (where it was possible) to lighten the file ... and probably could do much lighter and without all of that data ... but it came out so and maybe will improve it later :-) Click here to download the Excel file. See also here:Life Expectancy by Nathan Yau's chart with ExcelEdward Tufte's Slopegraphs in Excel
Colorblind Web Page Filter Build a Dynamic Chart There are many instances when one wants to create a chart that reflects a growing data set or a chart that shows only part of a data set. These are easily accomplished in Excel by creating named formulas and using these named formulas in charts. Download the zipped workbook containing the examples below Once the basic concepts illustrated below are well understood, Advanced Examples contains solutions to more complex requirements. An extension to the above ideas so that the user can specify the data to be shown using business terminology. Keywords: Named formula, dynamic formula, dynamic chart, name in chart, grow, self adjusting, auto adjust, graph partial range, select column or row, name, form control drop-down dropdown list box combo
Visualization: Motion Chart - Google Charts Overview A dynamic chart to explore several indicators over time. The chart is rendered within the browser using Flash. Note for Developers: Because of Flash security settings, this (and all Flash-based visualizations) might not work correctly when accessed from a file location in the browser (e.g., rather than from a web server URL (e.g., Example (Note that the following code will not work when loaded as a local file; it must be loaded from a web server.) Loading The google.load package name is "motionchart". The visualization's class name is google.visualization.MotionChart. var visualization = new google.visualization.MotionChart(container); Data Format The first column must be of type 'string' and contain the entity names (e.g., "Apples", "Oranges", "Bananas" in the example above). Setting Initial State Open a working chart and set the settings that you'd like to capture. Configuration Options Methods Events Data Policy
How to do a doughnut chart ? (Chandoo) Posted on February 20th, 2014 in Charts and Graphs - 23 comments Today lets take a stroll outside what Excel can do and make something fancy, fun and may be useful. Nowadays, many newspapers, websites and magazines are featuring info-graphics. An info-graphic is a collection of shiny, colorful & data-full charts (or often pieces of text.) What I am talking about is this: How to create this chart? A word of caution Before you smack your lips at the thought of stringy donuts, let me warn you. Go easy with these charts. Now that we have learned the ill-effects of donuts, let’s make & eat one, cause we are bad-ass like that. Set up data cells This is easy. In C5, write =1-C4 This will give us the balance portion of donut where thread should appear. Create a donut chart Select both cells and insert a donut chart. This is what we get. Make 2nd slice of donut transparent This is simple. Adding thread to donut – 2 ways to do it There are many ways to cook a donut. This is my favorite. What do you think?