
Top 6 des infographies et visualisations sur Game of Thrones - Webilicious Votes : 4.5/5 (8 votes fait) Comparable à la faune et la flore tolkenienne, l’univers fantastique de George R. R. Martin est d’une grande complexité. Si bien que nombre de fans du Trône de Fer se sont attelés à essayer de retranscrire de manière éclairante, les alliances et relations entre les innombrables protagonistes, ainsi que la chronologie des évènements par des techniques parfois novatrices. Voici une sélection des visualisations les plus marquantes. 1. 2. 3. 4. 5. 6. Bonus : 7.
If Obama had been Lincoln: 10 lines from Obama’s Second Inaugural Address that wouldn’t have been used in 1865 When writing his screenplay for the film Lincoln, playwright Tony Kushner used his copy of the Oxford English Dictionary to check for possible anachronisms, seeking to impart the flavor of 19th-century English to the script. How much has the vocabulary of English changed since Abraham Lincoln’s presidency? About 25% of the OED’s entries are for words which entered the English language after Lincoln delivered the Gettysburg Address, including racism (1926), leftist (1924), and boycott (1880). The chart below shows the OED’s headwords by decade of their first recorded date, highlighting the surge of new words in the late-19th century. Of course, that doesn’t mean that 25% of English in contemporary use consists of words adopted since 1863. It goes without saying that many of the ideas expressed in Obama’s speech—gay rights, expansion of the information infrastructure, the very fact of there being an African American president—would have been unimaginable in the 1860s. 1. 1941 F. 3. 4.
The 9 Best Data Visualization Examples from 2015 - ScribbleLive In the past, the idea of putting the words “creative” and “mathematician” in the same sentence would have seemed out of place. These days though, making sense of complex data requires design skills and number crunching that are as much art as they are science. If you think this stuff is simply for nerds, you might not be laughing when your buddy starts making $200,000 a year in his new gig as a data scientist. But whoever they are (and however much they get paid), the folks behind 2015’s best data visualizations have done the following things well: Used design and/or data science to make insights from a data set easily understoodDesigned a visualization that tells the whole story by itself, meaning it does note need added context to be compellingDelivers the data in a way that surprises, startles, or is (totally subjectively) awesome aesthetically Here are a few of our favorites from 2015. FlowingData: A Day in the Life of Americans Vocativ: How Americans Came to Accept Gay Marriage
Mitt Romney vs. the English Language My favorite moment of the 2012 presidential debates came at the beginning of the final confrontation Monday night. The moderator, Bob Schieffer, invited both candidates to “give your thoughts” on the Middle East. Republican nominee Mitt Romney went first and began with a typical stumbling attempt to be charming, almost successful in its very failure: Something about an earlier “humorous event” (it was the annual Al Smith dinner for the archdiocese of New York, at which politicians tell jokes) and how “it’s nice to maybe be funny this time, not on purpose. We’ll see what happens.” Huh? Then he moved into the mode where he sounds like a college freshman padding a term paper. (The other way to pad a term paper -- which Romney and I both learned at Cranbrook School in suburban Detroit in the 1960s -- is to stud it with irrelevant but impressive factoids, “swotted up,” as the Brits say, for the occasion. Disturbing Developments Back to the debate. Trust Matters
Dataviz : 5 projets de contenus et d'outils à la loupe En janvier dernier Ouest Médialab organisait un apéro StoryCode Grand Ouest entièrement dédié à la datavisualisation et au datajournalisme. 5 spécialistes du sujet sont donc venus nous présenter leurs réalisations, les outils qu’ils ont développé ou leurs projets en cours. Voici leur retours d’expériences. Ask Média : la production régulière d’infographies pour Paris Match L’agence spécialisée dans la réalisation d’infographies et de datavisualisations propose des sujets clés en main à plusieurs rédactions dont celle de Paris Match, pour qui elle prend en charge tous les 15 jours la recherche de données, l’enquête, la conception de l’infographie et bien sûr, sa réalisation. La plupart du temps, c’est à l’agence que revient le choix du sujet qui dépend surtout de la disponibilité des données. Pour réaliser une carte de ce type, l’équipe a eu recours à 3 jeux de données issus du Ministère de l’Intérieur et de l’INSEE. La plateforme Bakamap dédiée à l’exploration de vos données
#Tweet #Tweet Founded in 2006, Twitter is the online social networking service that allows its users to communicate via text-based messages of up to 140 characters, known as ‘tweets’. Communication in Twitter is fast-paced and it can be difficult to keep track of the talk that emerges, so a convention has arisen among Twitter users whereby a hashtag (#) can be used as a prefix to make the term searchable and then others can search for tweets that have that same topic. So, for instance, a search of #LFW this week in Twitter should produce a list of tweets relating to London Fashion Week. Anyone can start off a term with a hashtag and if it catches on and is used with sufficient frequency it can become what is known as a ‘trending topic’. To get an item into the list of trending topics is, according to researcher Ruth Page, a ‘signal of status and influence’. Overall, Page found that corporations and celebrities most frequently use hashtags.
Fantasy Map: Rail Transport in Westeros by Michael... - Transit Maps Fantasy Map: Rail Transport in Westeros by Michael Tyznik Not the first Game of Thrones/A Song of Ice of Fire transit map I’ve seen, but definitely the best designed. It was created by Michael Tyznik, who also made this great fantasy map of Columbus (May 2012, 4 stars). I do detect the influence of my TGV Routes of France map in this work – the general station symbology, the curved routes lines out of King’s Landing and the use of colour coding to define route groups – but Michael has done a fine job of taking things further. His intelligent use of non-standard angles keeps the map nice and compact, but also creates some nice, fun visual shapes. (Spoilers below, I guess…) There is some commentary in the map based on the events of the books and TV series, but it’s limited to some wry notes or labels: "Please pardon our dust as Harrenhal is restored", or having most of the stations on the Wall Line shown as being closed, for example. Source: Michael’s Behance page.
Representing gender in children's reading materials would a boy have been shown with flowers in the 1970s? Are girls and boys portrayed differently in children’s reading materials today than in the past? During the 1970s and 80s, studies of children’s reading materials found that males not only featured more than females but also they tended to take the lead roles and were more active than their female counterparts, who were often restricted to traditional stereotyped roles. Many of these earlier studies of gender in children’s reading material analysed the texts based on their content, which meant that researchers made their own judgements about what was sexist and what was not. Now, however, advances in computer and electronic technology mean that ‘corpus linguistics’ can be used to analyse texts more systematically. Using this method, John Macalister set about answering the question of how far gender roles in writing for children had changed since the 1970s.
the data of long distance lovers August 25, 2015 · textmining · It is a truism to say that relationship is hard to maintain. It might be even more difficult when the Atlantic Ocean separates them. But thanks to internet and those big data companies that feed themselves with our personal informations, we can now have a real relationship even with 5,500 km between us. Real in sense of small talks, common projects, and fights... To illustrate this point, here some analysis of our daily discussions through the phone app viber. The log hold slight more than a year of data and exactly 20,846 messages, she is responsible for 51.2% of the total. It is interesting to continue the comparison between Her and Him with a focus on the time taken to respond to a message. I like the previous graph that shows that more than 60% of messages from Her and Him are answered within 2 minutes. The table illustrates the huge difference between the mean and the median time to answer. As a bonus, here is the two personal wordcloud:
Ideas Illustrated » Blog Archive » Visualizing English Word Origins I have been reading a book on the development of the English language recently and I’ve become fascinated with the idea of word etymology — the study of words and their origins. It’s no secret that English is a great borrower of foreign words but I’m not enough of an expert to really understand what that means for my day-to-day use of the language. Simply reading about word history didn’t help me, so I decided that I really needed to see some examples. Using Douglas Harper’s online dictionary of etymology, I paired up words from various passages I found online with entries in the dictionary. The results look like this: The quick brown fox jumps over the lazy dog. This simple sentence is constructed of eight distinct words and one word suffix. A second example shows more variety: Supreme executive power derives from a mandate from the masses, not from some farcical aquatic ceremony. What follows are five excerpts taken from a spectrum of written sources. Passage #1: American Literature
The Ultimate Crowdsourced Map of Long Distance Relationships Around Valentine's Day this year, we got the idea of asking Atlas Obscura readers about one of the most fraught kind of relationships—the long distance kind, or LDRs. We assumed we'd get 50 or so responses, and maybe we'd pick a few stories to highlight. But nearly 600 of you filled out the survey. The results were incredible—and fill the interactive map above. People conducted relationships from the ends of the earth, spanning years and ostensibly filling whole hard drives with video chats and text messages. The reasons for the geographical spread were manifold, and many people reported being continents apart for years. Long distance relationships are not temporary. But the numbers can only tell us so much. Paradise Bay, Antarctica. Remote Locations New York, New York to McMurdo Station, Antarctica I was living in NY when I got an OkCupid message from someone in Denver, even though my searches were set to the NY metro area only. Bering Sea to New Milford, New Jersey Met Online
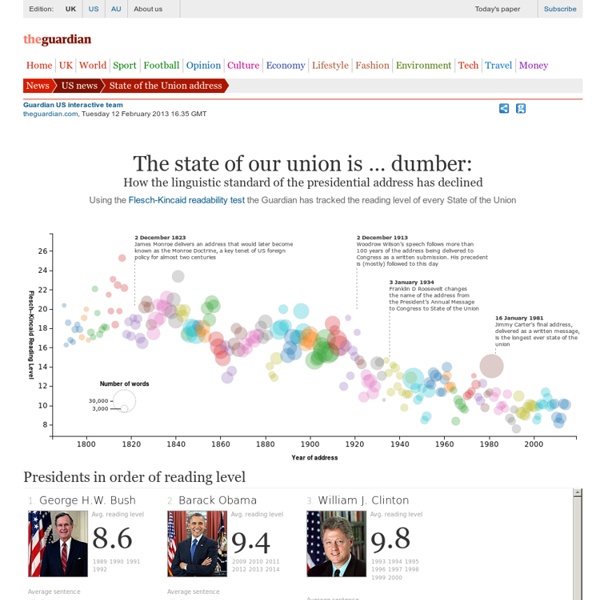
Readability-Score.com - Free Online Readability Calculator - Flesch Kincaid, Gunning Fog and more ... What You Like Falls on Party Lines Far and away, the Republican group is more country, while fans of Mrs. Clinton are more pop. At the top of the list for people who like Mrs. Clinton is Adele. On Mrs. Rocker Ted Nugent tops the list for people who like Mr. Language and gender on the internet Millions of people around the world take part in large-scale group discussions on the internet. These discussions have been likened to very large-scale conversations. We might wonder, therefore, whether the same kinds of gender differences exist in computer-mediated discussions as have been noted in face-to-face discussions. Susan Herring set out to investigate this question by analysing four public computer-mediated discourse samples from three academic discussion lists. In some of the online discussions there were more male than female participants, while in others there were more female participants. Herring points out that we might expect to find a ‘one-at-a-time floor’ in computer-mediated discussions. Herring, S.C. (2010) Who’s got the floor in computer-mediated conversation?