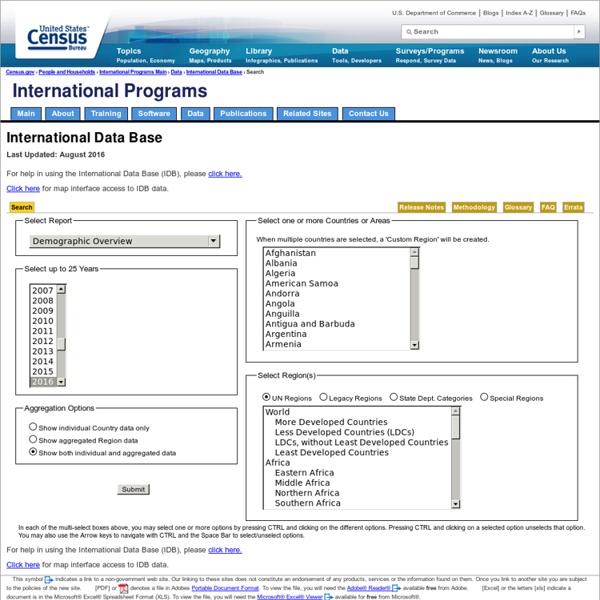
International Programs - Information Gateway

Lupa kuvien käyttöön Parkano ennen... Face ylläpitäjä jo digitalisoi, Timo Yliaho ...
IFAD Factsheets on rural areas worldwide
Follow us on Enabling poor rural peopleto overcome poverty Share on facebookShare on twitterShare on google_plusone_shareShare on tumblrShare on friendfeedShare on mailto Factsheets Thematic factsheets Climate change Climate change: Building smallholder resilience (2011) Arabic | English | French | Italian | Spanish IFAD, GEF Factsheet (2010) Arabic | English | French | Spanish Desertification Desertification (2010) Arabic | English | French | Spanish Fragile states Food security and price volatility The future of world food security (2012) English Water and food security (2012) English Higher and volatile food prices and poor rural people (2011) Arabic | English | French | Italian | Spanish Gender Gender equality and women’s empowerment (2012) Arabic | English | French | Spanish Factsheet on IFAD policy on gender equality and women’s empowerment (2012) Arabic | English | French | Spanish ICT for development Indigenous peoples Land Livestock Livestock services (2004) English | French | Italian Water
World Bank database - a goldmine !
This page in: Indicators Agriculture & Rural Development Aid Effectiveness Climate Change Climate Change Knowledge Portal Economy & Growth Household Consumption Data and Statistics Education Education Statistics: EdStatsService Delivery Indicators Energy & Mining Energy & Extractives Open Data Platform Environment External Debt Debt Data Financial Sector Financial Inclusion Gender Gender Equality Data & Statistics Health HealthStatsService Delivery Indicators Infrastructure Poverty Poverty & Equity Data Private Sector Doing BusinessEnterprise SurveysHousehold Consumption Data and Statistics Public Sector Data on Statistical CapacityCountry Policy & Institutional Assessments Science & Technology Social Development Social Protection & Labor ASPIRE: The Atlas of Social ProtectionJobs Data Trade WITS: World Integrated Trade Solution Urban Development Help us improve this site © 2016 The World Bank Group, All Rights Reserved.
Mielekästä harjoitusta Exel- taulukointiin, Google Sheet???
OECD – Your Better Life Index
Average personal index for Germany, men, 15–24 How’s life? There is more to life than the cold numbers of GDP and economic statistics – This Index allows you to compare well-being across countries, based on 11 topics the OECD has identified as essential, in the areas of material living conditions and quality of life. Download executive summary Download the index data Learn more about the index Better Life BlogArchive Happiness pays For World Happiness Day our guest author suggests that money can't buy you happiness but happiness may get you more money. more ... Gender equality in the workplace Over the past twenty years, women have made huge gains in the workplace but full job equality is still far from reality. more ... Education for well-being: Online discussion We know education is an essential component of well-being, so what makes an education that promotes well-being? more ... Visit our blog Blog RSS feed Find Out MoreArchive Mar 19, 2014 Society at a Glance 2014: OECD Social Indicators
Melu, datan kerääminen, tuottaminen
UNdata
Parkanon kotiseutumuseo , luetteloiden digitointi avaaminen
Jälkiä kartalle
Näiden ennakkotehtävien avulla pääsemme ensimmäistä työpajaa varten hieman sisälle karttojen, paikannuksen ja reittien maailmaan. Tehtävät on koottu Jälkiä kartalle -opintopiirin osallistujia varten, mutta ohjeita voi ehdottomasti ja tietenkin käyttää ihan kuka tahansa. Tehtävä 1 - Kuvat kartalla Tehtävän tarkoituksena on opetella lisäämään otettuja kuvia kartalle ja jakamaan kartta muille. Kuvat otetaan tässä tapauksessa ensin ja ne laitetaan kartalle nettiyhteyden ääressä. Alkutesti Tarkista, että tabletin tai älypuhelimen sijaintitiedot ovat päällä sekä laitteessa että kamerassa. iOS: Settings - Privacy - Location services “on” JA samasta näkymästä vielä kameran sijaintitiedot Camera “while using” tai “on” Asetukset – Tietosuoja – Sijaintipalvelut päälle, samasta näkymästä näkyy kameran asetus jonka tulisi olla ”päällä” tai ”ohjelmaa käytettäessä” Android: Asetukset - Sijantipalvelut - Valitse kaikki vaihtoehdot JA Kamera - Asetukset - GPS-tunniste Päälle Windows: Ota testikuva. Tehtävä
Related:


