
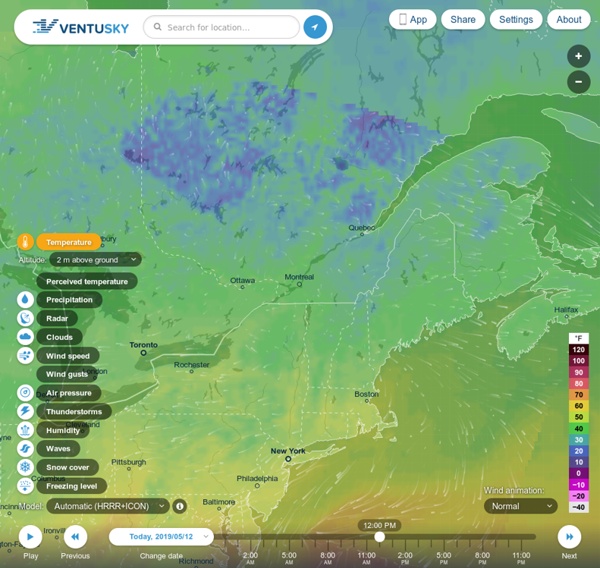
Windyty - weather forecast map reinvented Weather forecasts are boring. Ivo – developer, pilot and a kite surfer from Czech Republic decided to do something about it. He used an open source code from the Earth project and developed Windyty – one of those websites where you can lose a lot of time just staring and trying new views. The project is essentially a map of winds you can choose to overlay with weather conditions such as humidity and pressure zones. We can write on the website: I am an addicted kiter, helicopter and jet pilot, who seeks the wind, waves, METARs, TAFs and powder snow almost constantly […]. Windyty.com is free and a strictly non-commercial project. Related Amazing Interactive Map Of Wind The movement of air masses around the planet is fascinating. December 27, 2013 In "Featured" This awesome project maps the urban history of Barcelona Barcelona, the capital of Catalonia, is an amazing place to visit and to live. July 4, 2016 In "Maps"
World Migration | International Organization for Migration The GLOBAL MIGRATION FLOWS interactive app tracks migrants around the world. This application is now being hosted by IOM.int. It is endlessly fascinating to explore where we're from. The underlying data for the map was published by the UN DESA in 2015. Using the app: Choose whether you want to access information about migrants leaving a country (Outward) or migrants entering a country (Inward). This migration visualization tool is being developed by Locus Insight in collaboration with IOM. Note re web browser requirements: To view the migration app you will require a modern web browser. Sources: United Nations, Department of Economic and Social Affairs (2015). «La rapidité du réchauffement actuel est sans équivalent depuis au moins 8 000 ans» «Notre maison brûle et nous regardons ailleurs.» La formule prononcée par Jacques Chirac au Sommet de la Terre de 2002 n’a jamais été plus vraie qu’aujourd’hui. Pendant que nous assistons, sidérés, à l’emballement de l’actualité «chaude», à la multiplication des attentats et des crises géopolitiques, le globe se transforme – littéralement – en cocotte-minute. C’est moins spectaculaire, plus insidieux, mais les chiffres et les faits sont là, mois après mois. Le climat se réchauffe à un rythme inédit. Mardi, deux institutions américaines, la Nasa et l’Agence américaine océanique et atmosphérique (Noaa), annonçaient des données glaçantes. Et le premier semestre de 2016 a été de loin le plus chaud relevé dans les annales, «avec une température moyenne 1,3°C plus élevée qu’à la fin du XIXe siècle», souligne la Nasa. Le changement climatique semble s’accélérer et s’amplifier sous nos yeux de façon majeure. Les modèles climatiques avaient-ils prévu cela ? Coralie Schaub
Inondations historiques en Louisiane et dans le Mississipi (août 2016) – Planète Vivante Depuis le 13 août, des pluies torrentielles se sont abattues sur la Louisiane et le Mississipi provoquant l’évacuation de plus de 30 000 habitants et la mort de sept personnes. Le gouverneur de Louisiane, qui a déclaré l’Etat d’urgence, a évoqué des inondations «sans précédent» et 14 000 personnes ont été hébergées dans des refuges, essentiellement à Bâton Rouge et ses environs. le président Barack Obama a déclaré l’état de catastrophe naturelle, ouvrant ainsi la voie à des fonds fédéraux d’urgence pour soutenir les efforts des secours (Source : Le Monde). 15 cours d’eau ont atteint un niveau record pour des inondations qui sont qualifiées d’historiques. Des équipes d’urgence, prévenant la population que l’inondation n’était pas terminée, ont été déployées dans des véhicules amphibie, des bateaux et des hélicoptères. Bâton-Rouge, Louisiane Cause de ces inondations
Just 90 companies are to blame for most climate change, this 'carbon accountant' says | Science | AAAS Last month, geographer Richard Heede received a subpoena from Representative Lamar Smith (R-TX), chairman of the House of Representatives Committee on Science, Space, and Technology. Smith, a climate change doubter, became concerned when the attorneys general of several states launched investigations into whether ExxonMobil had committed fraud by sowing doubts about climate change even as its own scientists knew it was taking place. The congressman suspected a conspiracy between the attorneys general and environmental advocates, and he wanted to see all the communications among them. Predictably, his targets included advocacy organizations such as Greenpeace, 350.org, and the Union of Concerned Scientists. Heede is less well known than his fellow recipients, but his work is no less threatening to the fossil fuel industry. Heede's research shows that nearly two-thirds of anthropogenic carbon emissions originated in just 90 companies and government-run industries. Annual Emissions
167 Tiny Maps Tell the Major Story of Climate Change Climate change just got another telling visual courtesy of the famed temperature spiral creator. But rather than a graph, it’s a series of 167 maps. Alone, they each tell the story of whether a year was mostly hot or mostly cold or mostly average. These maps show how much the planet has warmed every year since 1850. Ed Hawkins, a climate scientist at the University of Reading, is responsible for the latest visual. Using a technique called “small multiples” developed by data visualization expert Edward Tufte, Hawkins mapped out the annual average temperature anomaly for every year from 1850 through 2016 using data from the UK Met Office. The technique allows viewers to consume a lot of information and then start searching for patterns in the data. There are patterns galore to dissect. And then there’s the back-to-back-to-back record hot years of 2014, 2015 and 2016 (in all likelihood anyways). Hawkins colored any square where six months of data is missing as a light gray.
Storm Spaces - Views of the World Tropical cyclonic systems are generally referred to as tropical storms. They are better known by their regional names, such as hurricanes in the Caribbean and North America, or typhoons in parts of Asia. They form near the equator over larger bodies of warm waters that evaporate from the ocean surface and fuel these emerging storm systems. Their strong winds and heavy rainfalls frequently become part of our news as they often put large numbers of human livelihoods at risk. Recent studies show that the number of tropical cyclones (as well as tropical cyclone intensity) over the past decades has increased. (click for larger version) For this cartogram, the observed tracks of storms in that period were analysed and their frequency and intensity was plotted onto a grid which provided the basis for the map transformation. A modified version of this feature was published in the July 2015 issue of Geographical Magazine.
A Brewing Storm: the climate change risks to coffee | The Climate Institute Synopsis Aug 29, 2016 - 12:01am The evidence is clear that climate change is already beginning to impact on coffee production. As the world continues to warm, market and climate volatility will combine to cause problems for coffee producers and consumers. Fairtrade Australia & New Zealand commissioned this report by the Climate Institute to better understand the extent to which climate change is impacting coffee production globally. On this page you'll find the report and related infographics. To access the media release click here. Read Report Video Coverage ABC News package on A Brewing Storm. Partners This report was commissioned by Fairtrade Australia & New Zealand. Banner Image: Ingmar Zahorsky/Flickr licensed under CC BY-NC-ND 2.0.
Resurrection Plants May be the Answer to Global Food Shortage | Atlas Lens It’s hard to recall in recent memory any year that didn’t set a record high temperature somewhere. Climate change continues to devastate the globe with everything from drought and dangerous weather events to rising sea levels and ecosystem degradation. However, perhaps the most imminent threats posed by climate change are those that affect humans directly, especially those of us in already-vulnerable parts of the world. Water scarcity in developing nations is nothing new and continues to worsen. However, due to crippling drought, another dagger is being thrust into ground: increased food shortage. Jill Farrant is a leader in drought-tolerant crop development. Farrant’s TED talk, “How We Can Make Crops Survive Without Water”, gives us a glimpse of what a resurrection plants-based solution may look like. #1: Population vs. “The current world population is around 7 billion. Even when wheat was nearing record supply in 2012-13, it could not satiate the market. #2: Of Wheat, Maize, and Soy
Super Typhon Meranti mise à jour (13/09/2016 23h UTC) – Planète Vivante Le Super typhon Meranti devrait partiellement épargner Taïwan mais en raison de sa grande taille (200 km de rayon) les bandes nuageuses risquent de déverser de grosses précipitations, provoquer des glissements de terrain et occasionner des vents très puissants. Il va continuer sa trajectoire en direction de l’Ouest-Nord-Ouest à 20 km/h avec des vents maximum soutenus à 220 km/h et des rafales à 300 km/h. Sa pression au centre était de 890 hPa selon les données de la JMA (Japan Meteorology Agency) à 21h50 UTC le 13/09. Il était prévu qu’il passe à moins de 80 km au Sud de Taïwan à 00h UTC. Meranti est le puissant typhon depuis le super typhon Haiyan qui a détruit une partie des Philippines en 2013. Source de l’image de haut de page : Typhon Meranti, categorie 5 – Image satellite visible Mardi mardi soir heure locale – 13/09/2016.