Infographics for the People – INFORMATION DESIGN AND DATA VISUALIZATION
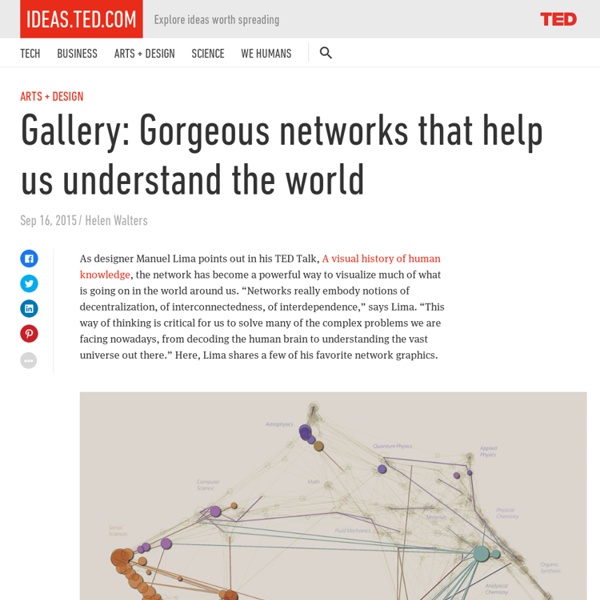
A comparison of primary mirrors. If a telescope has more than one mirror, the dotted lines show how large a single mirror would be (if it had the equivalent light-gathering ability). Below, some details of the three telescopes with the largest mirrors.Infographic by Cmglee (via Wikimedia). Overwhelmingly Large Telescope (OLT)Sadly this massive example (with its “this-is-what-it-is” name) has been canceled. Image: ESO. Extremely Large Telescope (ELT)Under construction in the Atacama Desert, Chile. Image: Swinburne Astronomy Productions/ESO Thirty Meter Telescope (TMT)Proposed for Mauna Kea, Hawaii. Image: TMT Observatory Corporation Laser guideThe Very Large Telescope (VLT) in the Atacama Desert, Chile, is an array of four large optical telescopes, and four smaller auxiliary telescopes, working in unison. Photograph: G.Hüdepoh/ESO. Hubble Space TelescopeThis very successful orbital workhorse was launched in 1990 into a low Earth orbit of 340 miles (547 km). Photograph: NASA. Inside view.
Infographic therapy – Infographics for the People
I’m a procrastinator, so this map by makes so much sense to me. (Now, why don’t I finish this post tomorrow?) Below, the angst of being creative, by Christoph Niemann. Wendy MacNaughton’s working day. Jeremy Nguyen’s imagined a set of freelancer stickers (for the New Yorker). Portfolio dilemma, and font overload by Mitch Goldstein. Karl Gude highlights our tendency to define ourselves as under-achievers because of one super-successful outlier.
Mid-century 3D data viz – Infographics for the People
This set of 675 hand-cut cards shows the demand for electricity between October 1951 and April 1954. The cards are held by metal uprights on a wooden base, and were once enclosed in glass. Dimensions: 26.5 x 12 x 14 inches (67 x 31 x 36 cm). Each card plots demand in megawatts over the course of one day in 30-minute increments. Photographs: Museum of Science and Industry. This kind of load model is not unique. Image: The British Library.
Informational wheels – Infographics for the People
Classic info-design from the last century that still records a high score on the official Grimwade user-engagement scale. The Dist-O-Map (above) first appeared in the 1960s, and was still in production in 2008. This post follows on from: Cardboard interactives: Wheel of excuses/Cardboard interactives (2):
Cosmigraphics: Picturing Space Through Time in 4,000 Years of Mapping the Universe
Long before Galileo pioneered the telescope, antagonizing the church and unleashing a “hummingbird effect” of innovation, humanity had been busy cataloging the heavens through millennia of imaginative speculative maps of the cosmos. We have always sought to make visible the invisible forces we long to understand, the mercy and miracle of existence, and nothing beckons to us with more intense allure than the majesty and mystery of the universe. Four millennia of that mesmerism-made-visible is what journalist, photographer, and astrovisualization scholar Michael Benson explores with great dedication and discernment in Cosmigraphics: Picturing Space Through Time (public library) — a pictorial catalog of our quest to order the cosmos and grasp our place in it, a sensemaking process defined by what Benson aptly calls our “gradually dawning, forever incomplete situational awareness.” Contemporary thought is endangered by the picture of nature drawn by science.
Let’s All Obsess Over This Intricate Map of Alt Music History
It started with the Sex Pistols. Specifically, with the Sex Pistols’ June 4, 1976, show at the Lesser Free Trade Hall in Manchester, England. The concert now ranks as one of the most influential performances of all time, up there with Woodstock. But the audience, not the band, made the show famous. Around 30 or 40 people showed up (although thousands would later claim to have attended), and rumor has it that the crowd included the guys who would go on to start bands like the Smiths, Joy Division, and the Buzzcocks. Rumors are enough for the designers at Dorothy, a studio that just released a data-viz poster called “Alternative Love Blueprint—A History of Alternative Music.” To organize these complex connections, Quail based the poster on a circuit board from a transistor radio. Like a Spotify Weekly playlist manifested into poster form and frozen in time, the “Alternative Love Blueprint” uses musical connections to identify listening recommendations.
How Pop Chart Lab Made That Amazing Apple Infographic
Robby Stein remembers when Kevin Systrom was just another startup guy, who’d created a photo sharing app called Instagram. They knew each other working at Google. Systrom’s idea for the thing was all around instant sharing—to capture fleeting moments, like a dog you met or going to the park. "People would comment, and then you’d have a conversation," recalls Stein. And yet a funny thing happened on Instagram’s march to 500 million users. They had seemed like such an obvious thing to add. The solution was Instagram Stories, a way of quickly sharing videos and pictures that disappear after 24 hours. Different Space Means Different Rules Instagram revolves around the story feed—a stream of images and captions that users scroll past. Those rules, ultimately, flowed from the idea that Stories would have to have different incentives and feedback loops if it was going to nudge people into sharing things without overthinking them. What would happen if you were watching someone’s Story?
The Roads of Ancient Rome Visualized in the Style of Modern Subway Maps
Sasha Trubetskoy, an undergrad at U. Chicago, has created a "subway-style diagram of the major Roman roads, based on the Empire of ca. 125 AD." Drawing on Stanford’s ORBIS model, The Pelagios Project, and the Antonine Itinerary, Trubetskoy's map combines well-known historic roads, like the Via Appia, with lesser-known ones (in somes cases given imagined names). If you want to get a sense of scale, it would take, Trubetskoy tells us, "two months to walk on foot from Rome to Byzantium. If you had a horse, it would only take you a month." You can view the map in a larger format here. Would you like to support the mission of Open Culture? Also consider following Open Culture on Facebook and Twitter and sharing intelligent media with your friends. Note: This map first appeared on our site back in 2017. Related Content: “The Wonderground Map of London Town,” the Iconic 1914 Map That Saved the World’s First Subway System Fashionable 2,000-Year-Old Roman Shoe Found in a Well
Dog Breeds Ranked by Temperament - Earthly Mission
The below infographic ranks 114 dog breeds based on the American Temperament Test Society’s temperament test data since 1977. The temperament test measures ‘stability, shyness, aggressiveness, and friendliness as well as the dog’s instinct for protectiveness towards its handler and/or self-preservation in the face of a threat’ by simulating a walk through a neighborhood where daily life situations occur. The dog experiences visual (sudden sights like opening umbrellas), auditory (sounds like gunshots and hidden noises), and tactile (walking on different types of surfaces) stimuli. The exercise also tests their behavior toward friendly, neutral, and hostile strangers. A dog fails the test if it shows unprovoked aggression, panic without recovery, or intense fear and avoidance. As of December 2017, 34,686 dogs have been tested; 29,017 have passed and 5,669 have failed, making the pass rate 83.7%.