
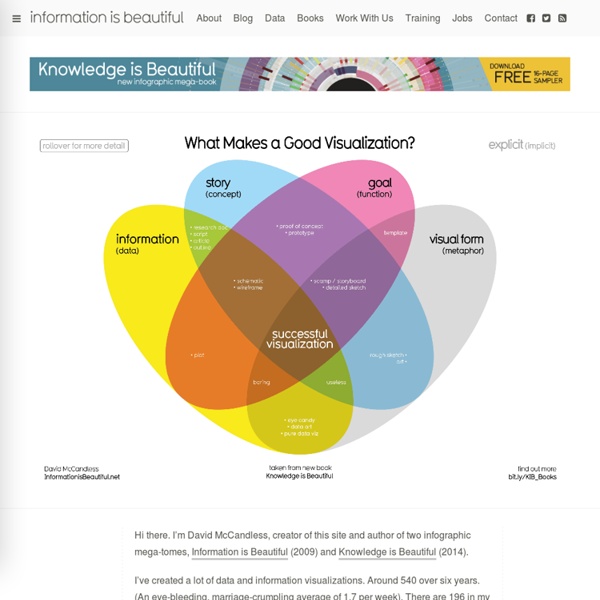
Visual Thinking What is Visual Thinking? Visual thinking is a way to organize your thoughts and improve your ability to think and communicate. It’s a great way to convey complex or potentially confusing information. It’s also about using tools — like pen and paper, index cards and software tools — to externalize your internal thinking processes, making them more clear, explicit and actionable. Why is Visual Thinking important? There’s more information at your fingertips than ever before, and yet people are overwhelmed by it. But can I do this? Drawing is a natural process for thinking, exploring ideas and learning. “I’m no artist” “I can’t draw a straight line” “I can’t draw a stick figure” This is a fallacy. Don’t believe me? Visual Thinking basics In this 20-minute video I share some basics of visual thinking that will get you up and running in about 20 minutes. How to know what to draw Visual thinking reading list.
AnalyticsZone Blog Guest post by Noah Iliinsky, IBM visualization luminary. This is a continuation of a series of posts covering the Four Pillars of Visualization. If you haven't done so already, please read the introductory post and the post, "Purpose: the bedrock of an effective visualization." Now that we have determined our purpose (the why of this visualization) we can start thinking about what we want to visualize. Our task is to include the relevant data (that which we know is useful) and to leave the rest out. To figure out what to include, we look to our purpose to tell us the most important data points and relationships. We want this visualization to enable the following actions/decisions: _____ To do this, it needs to be able to answer these questions: _____ To answer those questions, we need to display these data types: _____ As you're selecting data to display, resist the urge to show everything all at once: remember that extra information is the same thing as noise.
AnalyticsZone Blog Guest post by Noah Iliinsky, IBM visualization luminary. This is a continuation of a series of posts covering the Four Pillars of Visualization. Please read my previous article , which describes these pillars as: purpose, content, structure and formatting. This post focuses on the first of these. What is your purpose? *This posts addresses creating visualizations for presentation. There's a reason the purpose phase comes before the other three phases. A useful purpose must take into account questions like: The more you know about your customer and how they will consume your visualization, the more clear and accurate your can make your purpose, and the greater your odds of success. So what does a good purpose look like? To be most successful, different uses (purposes!) The route from Seattle to Baltimore (above) is very similar to the route from Seattle to New York City (below), except at the critical point -- the arrival. Why stop the insight with this article?
AnalyticsZone Blog Guest post from Noah Iliinsky, Advanced Visualization Expert, IBM Center for Advanced Visualization This is the first of a series of five posts discussing the four pillars of successful visualizations. In this article I’ll introduce the four pillars and discuss why they’re in the order they’re in; and then in subsequent posts I’ll examine each pillar in depth and explain how to think about and use the concepts when building an effective data visualization. A successful visualization: > has a clear purpose and focus > contains (only) the right content > is structured correctly > has useful formatting Therefore, the pillars are, in this order: 1. purpose 2. content 3. structure 4. formatting Purpose is the specification for your entire effort. Content is pretty straight forward. Structure is the physical layout of your visualization. **By definition, if you’re visualizing knowledge, you’re placing it in space. That’s the overview of the four pillars. For more information:
AnalyticsZone Presents: Creating Effective Visualization Series with Noah Iliinsky The world produces more than 2.5 exabytes of data every day. Visualization is one key approach to gaining insight from this flood of big data. Visualization makes data accessible, and is one of the best ways to analyze and understand the huge volumes that we're accumulating. The world produces more than 2.5 exabytes of data every day.
Perceptual Edge A Guide to Control Charts Control charts have two general uses in an improvement project. The most common application is as a tool to monitor process stability and control. A less common, although some might argue more powerful, use of control charts is as an analysis tool. The descriptions below provide an overview of the different types of control charts to help practitioners identify the best chart for any monitoring situation, followed by a description of the method for using control charts for analysis. Identifying Variation When a process is stable and in control, it displays common cause variation, variation that is inherent to the process. Control charts are simple, robust tools for understanding process variability. The Four Process States Processes fall into one of four states: 1) the ideal, 2) the threshold, 3) the brink of chaos and 4) the state of chaos (Figure 1).3 When a process operates in the ideal state, that process is in statistical control and produces 100 percent conformance. Xbar-Range Charts
Types of Control Charts Last year I wrote an Introduction to Control Charts (Run Charts). I referenced a favorite book of mine, Understanding Variation: The Key to Managing Chaos, by Donald Wheeler of SPC Press, an expert in Statistical Process Control. This book is a quick read, and it’s a great introduction to control charts, written clearly using layman’s terms, with a number of very good examples to illustrate their use. In fact, in my last engineering job before becoming a full-time Excel jockey, I was frustrated by many operational features in the manufacturing facility where I worked. Types of Control Chart A control chart, or run chart, is essentially a time series that shows variation in a process output over a period of time. Wheeler’s book demonstrates statistical process control using the simplest type of control chart. Individuals (XMR) chart, comprised of X chart (top) and R chart (bottom)from Introduction to Control Charts (Run Charts) Selecting a Control Chart Interpreting Control Charts
Barnstable County Septic System Database: Posts There are many ways to visualize data, from line charts to histograms and pie charts. Visualizing effluent sampling data for I/A systems is cumbersome in most of these formats, as the data sets are typically very large. Box-whisker diagrams present a nice solution by providing in a way that is compact and easy to analyse. What are Box-Whisker Diagrams? Figure 1. Box-whisker diagrams display differences between populations or sets of data in a compact format that is easy to interpret. Box-whisker plots are composed of two main parts (figure 1): A box and whiskers. The box part of the box-whisker diagram represents the middle 50% of the values of whatever is being measured, with the bottom of the box representing the 25th percentile and the top of the box representing the 75th percentile. In the center of the box is a horizontal line which represents the median (middle) value. Figure 2. When graphed with real data, box-whisker diagrams can take on many different looks (Figure 2).
30 Simple Tools For Data Visualization There have never been more technologies available to collect, examine, and render data. Here are 30 different notable pieces of data visualization software good for any designer's repertoire. They're not just powerful; they're easy to use. In fact, most of these tools feature simple, point-and-click interfaces, and don’t require that you possess any particular coding knowledge or invest in any significant training. 1. iCharts 2. FusionCharts Suite XT is a professional and premium JavaScript chart library that enables us to create any type of chart. 3. Modest Maps is a small, extensible, and free library for designers and developers who want to use interactive maps in their own projects. 4. Pizza Pie Charts is a responsive pie chart based on the Snap SVG framework from Adobe. 5. Raw is a free and open-source web application for visualizing data flexibly and as easy as possible. 6. Leaflet is a modern open-source JavaScript library for mobile-friendly interactive maps. 7. 8. 9. 10. 11.
InfoGraphic Designs: Overview, Examples and Best Practices Information graphics or infographics are visual representations of information, data or knowledge. These graphics are used where complex information needs to be explained quickly and clearly, such as in signs, maps, journalism, technical writing, and education. They are also used extensively as tools by computer scientists, mathematicians, and statisticians to ease the process of developing and communicating conceptual information. They can present a rich amount of information without intimidating you. Or sometimes they intimidate you, but make the digesting of the information much more bearable. Here in this article below, we are going to discuss best practices for designing infographics followed by some examples which might help you learn a thing or two. You may be interested in the following related articles as well. Feel free to join us and you are always welcome to share your thoughts that our readers may find helpful. Don’t forget to and follow us on Twitter — for recent updates. 01.
Chart Porn FlowingData