
Selezione Di Un Modello in “Dizionario di Economia e Finanza” Q-Q plot. Da Wikipedia, l'enciclopedia libera.
Per plotting position si intende l'assegnazione di una famiglia di distribuzioni di frequenze ad un set di dati per andare a determinare una funzione di frequenza cumulata. Risulta essere l'operazione di plotting position una stima del valore teorico di F(xi). Se si è in possesso di un set di dati con diversi valori, è evidente che per andarli a porre in un diagramma delle frequenze cumulate, e quindi per poter valutare il loro comportamento, si dovrà assegnare una frequenza relativa ad ognuno di questi dati.
L'azione che ci permette di assegnare una frequenza relativa al set di dati è, per l'appunto, la plotting position. Permutation tests in R. Permuation tests (also called randomization or re-randomization tests) have been around for a long time, but it took the advent of high-speed computers to make them practically available.

They can be particularly useful when your data are sampled from unkown distributions, when sample sizes are small, or when outliers are present. R has two powerful packages for permutation tests – the coin package and the lmPerm package. In this post, we will take a look at the later. The lmPerm package provides permutation tests for linear models and is particularly easy to impliment. You can use it for all manner of ANOVA/ANCOVA designs, as well as simple, polynomial, and multiple regression. Example Consider the following analysis of covariance senario. The data are contained in the litter dataframe available in the multcomp package. If we were going to carry out a traditional ANCOVA on this data, it would look something like this: From the graph, we have to question the normality assumption here. Stepwise regression. Linear Transformations in Regression. When a residual plot reveals a data set to be nonlinear, it is often possible to "transform" the raw data to make it more linear.
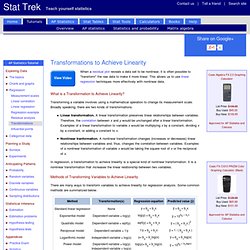
This allows us to use linear regression techniques more effectively with nonlinear data. What is a Transformation to Achieve Linearity? Transforming a variable involves using a mathematical operation to change its measurement scale. Broadly speaking, there are two kinds of transformations. Linear transformation. In regression, a transformation to achieve linearity is a special kind of nonlinear transformation. Methods of Transforming Variables to Achieve Linearity. Chi Square Statistics. Types of Data: There are basically two types of random variables and they yield two types of data: numerical and categorical.

A chi square (X2) statistic is used to investigate whether distributions of categorical variables differ from one another. Basically categorical variable yield data in the categories and numerical variables yield data in numerical form. Responses to such questions as "What is your major? " or Do you own a car? " Notice that discrete data arise fom a counting process, while continuous data arise from a measuring process. The Chi Square statistic compares the tallies or counts of categorical responses between two (or more) independent groups. 2 x 2 Contingency Table. The PRINQUAL Procedure: Multidimensional Preference Analysis of Automobile Data. tesi.cab.unipd.it/84/1/Camporese.pdf. www.soziologie.uni-halle.de/langer/logitreg/books/long/stblistcoef.pdf. P-P plot. Da Wikipedia, l'enciclopedia libera.
Da non confondere con Q-Q plot Un P-P plot (Probability-Probability plot, o Percent-Percent plot) è un probability plot per valutare quanto due set di dati siano simili, tracciando su di un grafico le due cdf. Questo è meno utilizzato del Q-Q plot, ma entrambi vengono definiti come diagrammi di probabilità, e quindi sono facilmente confondibili dai non esperti.
Definizione[modifica | modifica sorgente] How to Interpret Regression Analysis Results: P-values and Coefficients - Adventures in Statistics. Regression analysis generates an equation to describe the statistical relationship between one or more predictor variables and the response variable.
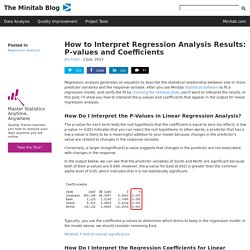
After you use Minitab Statistical Software to fit a regression model, and verify the fit by checking the residual plots, you’ll want to interpret the results. In this post, I’ll show you how to interpret the p-values and coefficients that appear in the output for linear regression analysis. How Do I Interpret the P-Values in Linear Regression Analysis? The p-value for each term tests the null hypothesis that the coefficient is equal to zero (no effect). Metodo della massima verosimiglianza. Da Wikipedia, l'enciclopedia libera.

Filosofia del metodo della massima verosimiglianza[modifica | modifica sorgente] Likelihood-ratio test. In statistics, a likelihood ratio test is a statistical test used to compare the fit of two models, one of which (the null model) is a special case of the other (the alternative model).
The test is based on the likelihood ratio, which expresses how many times more likely the data are under one model than the other. This likelihood ratio, or equivalently its logarithm, can then be used to compute a p-value, or compared to a critical value to decide whether to reject the null model in favour of the alternative model. When the logarithm of the likelihood ratio is used, the statistic is known as a log-likelihood ratio statistic, and the probability distribution of this test statistic, assuming that the null model is true, can be approximated using Wilks's theorem.
Use[edit] Each of the two competing models, the null model and the alternative model, is separately fitted to the data and the log-likelihood recorded. Background[edit] The likelihood ratio, often denoted by .
Model. Wikipedia. Six Sigma. Statistics.