
Landing.oz-code. Don't Overthink It Grids. FireQuery is a Firebug extension for jQuery development.
Profilers. JustTrace. SharpDevelop @ic#code. Raygun - Error reporting for .NET, PHP, Ruby, Java and more. Unlimited users Raygun supports as many users as you need - 1 developer?

No problem. 50 developers? No problem! Raygun even includes first class Organization and Team support. Setup teams and assign applications to be monitored by those teams. Multiple Applications It's rare to only have a single application - often you'll have several moving parts: offline processes, a main website, a search indexer, and email service - the list goes on! Advanced Notifications 1000 errors in an hour means you get emailed 1000 times right? CodeXL. AMD CodeXL is a comprehensive tool suite that enables developers to harness the benefits of AMD CPUs, GPUs and APUs.
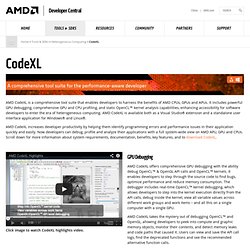
It includes powerful GPU debugging, comprehensive GPU and CPU profiling, and static OpenCL™ kernel analysis capabilities, enhancing accessibility for software developers to enter the era of heterogeneous computing. AMD CodeXL is available both as a Visual Studio® extension and a standalone user interface application for Windows® and Linux®. AMD CodeXL increases developer productivity by helping them identify programming errors and performance issues in their application quickly and easily. Now developers can debug, profile and analyze their applications with a full system-wide view on AMD APU, GPU and CPUs. Scroll down for more information about system requirements, documentation, benefits, key features, and to download CodeXL. Blogs. Debugging tools - DevPartner.
Memory usage analysis – line-of-code level Determine the objects and allocations responsible for accumulating memory that could lead to resource exhaustion and instability.
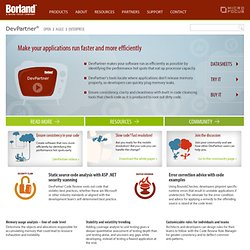
Stability and volatility trending Adding coverage analysis to unit testing gives a deeper quantitative assessment of testing depth than unit testing alone, and uncovers any gaps while developing, instead of testing a flawed application at the end. MSDN Magazine: Toolbox - Tools and Techniques for .NET Code Profiling. The pithy epigram “premature optimization is the root of all evil” has been variously attributed over the years to Donald Knuth, William Wulf and C.A.R.
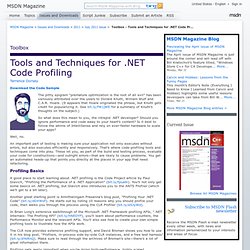
Hoare. (It appears that Hoare originated the phrase, but Knuth gets credit for popularizing it. See bit.ly/fW1jWE for a summary of Knuth’s thoughts on the subject.) So what does this mean to you, the intrepid .NET developer? Should you ignore performance and code away to your heart’s content? Using the MVC-Mini-Profiler with Entity Framework. The MVC Mini Profiler is an awesome tool that can help you reduce your page load times by showing you exactly how long each action, database query, view and even partial view took to load.
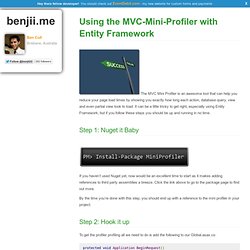
It can be a little tricky to get right, especially using Entity Framework, but if you follow these steps you should be up and running in no time. Step 1: Nuget it Baby If you haven’t used Nuget yet, now would be an excellent time to start as it makes adding references to third party assemblies a breeze. Click the link above to go to the package page to find out more. By the time you’re done with this step, you should end up with a reference to the mini profiler in your project. Step 2: Hook it up To get the profiler profiling all we need to do is add the following to our Global.asax.cs:
PageSpeed Insights. CodeBurner - Reference Tool for Web Developers. Web Developer. ReflectInsight - Log Viewer for NLog, Log4net, Enterprise Library & Debug/Trace - Home. Now on IE and Firefox: Debug your mobile HTML5 page remotely with weinre (WEb INspector REmote) Great news for HTML5 mobile developers: the remote DOM inspector tool weinre is no longer restricted to Webkit-based browsers and can be used with Internet Explorer 10 or Firefox, thanks to the community contribution with technical support from Microsoft Open Technologies, Inc.
.NET Crash Dump and Live Process Inspection - .NET Blog. Analyzing crash dumps can be complicated.
Although Visual Studio supports viewing managed crash dumps, you often have to resort to more specialized tools like the SOS debugging extensions or WinDbg. In today’s post, Lee Culver, software developer on the .NET Runtime team, will introduce you to a new managed library that allows you to automate inspection tasks and access even more debugging information. --Immo Today are we excited to announce the beta release of the Microsoft.Diagnostics.Runtime component (called ClrMD for short) through the NuGet Package Manager. Improving Your App's Performance with PerfView - .NET Blog. Late last year, Vance Morrison, who is currently an architect on the .NET Framework Performance team, released PerfView, which is a new performance tool for .NET developers.
New .NET Diagnostic info added to Process Explorer - .NET Blog. Productivity is the hallmark of programming with managed code.
So often productivity boils down to figuring out why something isn’t working – diagnostics. The CLR provides one of the best foundations for diagnostics. In this post, Richard Lander – a program manager for the Common Language Runtime – shows how more than just developers can now track down root causes for problems. -- Brandon In this post, we will look at a new feature in Process Explorer, the popular SysInternals tool, which enables developers and IT Pros to collect accurate stack traces for .NET applications. Debugging and Tuning Web Sites and Apps with F12 Developer Tools in IE11 - IEBlog. Internet Explorer 11 on Windows 8.1 and Windows 7 comes with a completely redesigned and enhanced suite of in-browser developer tools that help developers build, diagnose, and optimize modern Web sites and apps across multiple devices.
The new tools, which we call F12 for short, enable Web developers to work quickly and efficiently. Firebug. Troubleshoot ASP.NET Performance Problems with StackExchange's MiniProfiler. Related: "ASP.NET Web Development: Get a Glimpse into Your Web Server" I recently worked on a project that involved some HTTP handlers and modules in an ASP.NET MVC 4 application that included some performance and profiling work.
During the course of research for that project, I stumbled on a gem that has evaded my knowledge until now, even though I know now that people such as Scott Hanselman were talking about the tool as far back as 2011. That gem is MiniProfiler. It's developed by the folks who brought us StackExchange, and it's a marvelous resource for getting technical questions answered. MiniProfiler is a minimal but very effective tool for .NET and Ruby applications. At runtime, MiniProfiler puts an easily accessible but unobtrusive element in the upper-left corner of the page that displays the total loading time for the page, see Figure 1.