
Interactive Map - Water. Water Security Maps. (Updated 28 November 2012) Here we shall present maps (list, details and sample of maps below) related to global water security that are useful for both analysis and delivery of products.

As new maps are created and found, they will be added to the corresponding Pearltree #Watermaps. The Pearltree can be accessed, as for the energy security bibliography, by clicking on the Pearl on the right hand side of this paragraph, or in the embedded application below. You are welcome to share your findings by joining the team on Pearltree. Maps are both necessary tools for analysis and crucial delivery visuals for our foresight and warning products. They constitute a category of delivery form, which can, furthermore, be combined with other categories to suit at best our needs. The maps under copyrights that do not allow fair free use (C.C.) are filed at the bottom of the post. National Intelligence Council (US), ODNI – 2012: Global Water Security Map Aquastat (FAO) maps MacDonald, et al. Water Conflict Chronology Map. SWFWMD%20district_map_for_print_0. Unsustainable water. South American drought fuels fears of food price shocks, as soya bean harvests suffer The viability of water supplies throughout key regions of China, India, Pakistan, South Africa and the US are under threat from unsustainable domestic, agricultural and industrial demands, according to a new study that maps water use down to 10km² worldwide.
The growth economies of China and India, and the world’s largest economy USA are identified by risk analysis company Maplecroft, in its newly released Water Stress Index, as having vast geographical regions and sector areas where unsustainable water use is outstripping supply. Maplecroft states that the situation so serious, it has the potential to limit economic growth by constraining business activities, as well as hampering agricultural outputs. India: non-classified river basins - Integrated hydrological data book by Central Water Commission, Ministry of Water Resources.
This book is a compendium of hydrogeological data related to major river basins in India This data book published by Central Water Commission (CWC) is a compendium of important hydrological information on major basins in India.
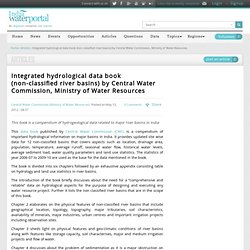
It provides updated site wise data for 12 non-classified basins that covers aspects such as location, drainage area, population, temperature, average runoff, seasonal water flow, historical water levels, average sediment load, water quality parameters and land use statistics. The statistics of year 2006-07 to 2009-10 are used as the base for the data mentioned in the book. The book is divided into six chapters followed by an exhaustive appendix consisting table on hydrology and land use statistics in river basins. The introduction of the book briefly discusses about the need for a “comprehensive and reliable” data on hydrological aspects for the purpose of designing and executing any water resource project. Chapter 5 is on water quality statistics. Worldmapper: water. FAO's maps on Water and Agriculture (AQUASTAT)
Quantitative maps of groundwater in Africa. USGS Details Effects of Climate Change on Water Availability in 14 Local Basins Nationwide. Climate change projections indicate a steady increase in temperature progressing through the 21st century, generally resulting in snowpack reductions, changes to the timing of snowmelt, altered streamflows, and reductions in soil moisture, all of which could affect water management, agriculture, recreation, hazard mitigation, and ecosystems across the nation.
Despite some widespread similarities in climate change trends, climate change will affect specific water basins in the U.S. differently, based on the particular hydrologic and geologic conditions in that area. New USGS modeling studies project changes in water availability due to climate change at the local level. So far, the USGS has applied these models to fourteen basins, including: These local projections are based on General Circulation Models (GCM) that predict how climate change will affect temperature, precipitation, and emissions for large regional areas. Iran: Interbasin Water Transfers. The country already has major water transfer projects moving 2,110 million cubic meters (557 billion gallons).
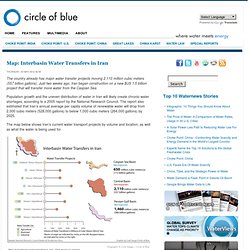
Just two weeks ago, Iran began construction on a new $US 1.5 billion project that will transfer more water from the Caspian Sea. Population growth and the uneven distribution of water in Iran will likely create chronic water shortages, according to a 2005 report by the National Research Council. The report also estimated that Iran’s annual average per capita volume of renewable water will drop from 2,000 cubic meters (528,000 gallons) to below 1,000 cubic meters (264,000 gallons) by 2025. Mapping Global Water Stress - Technology. Water scarcity is likely to be one of the great problems facing the planet this century.
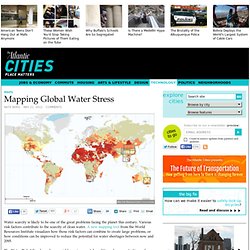
Various risk factors contribute to the scarcity of clean water. A new mapping tool from the World Resources Institute visualizes how those risk factors can combine to create large problems, or how conditions can be improved to reduce the potential for water shortages between now and 2095. The Water Risk Atlas shows how variable environmental conditions, human activities and regulatory environments affect the stability of water sources all over the world.
Water Risk Atlas: click on pearl to access app. Water Security Maps.