Data set analysis

TwitterFacebook
Get flash to fully experience Pearltrees

Homepage — Modular toolkit for Data Processing (MDP)

From the user’s perspective, MDP is a collection of supervised and unsupervised learning algorithms and other data processing units that can be combined into data processing sequences and more complex feed-forward network architectures. From the scientific developer’s perspective, MDP is a modular framework, which can easily be expanded. The implementation of new algorithms is easy and intuitive. http://mdp-toolkit.sourceforge.net/
http://people.csail.mit.edu/rasmus/summon/index.shtml#screenshots 2008.01.24 - The new release summon-1.8.4 contains updates for the core library and SUMMATRIX ( change log ). SUMMATRIX can now display hierarchical trees next to matrices (see manual), which is useful for visualizing clusterings. I have also begun to add a quick online tutorial .

SUMMON: visualization prototyping and scripting - Matt Rasmussen

http://net.tutsplus.com/tutorials/javascript-ajax/visualizing-data-with-flot/ There are a lot of tutorials on how to make CSS bar graphs. But sometimes, bar graphs aren’t enough. What if our data tracks change over time and a line graph is more appropriate?

Visualizing Data with Flot

XmdvTool Home Page: Overview

Overview XmdvTool is a public-domain software package for the interactive visual exploration of multivariate data sets. 
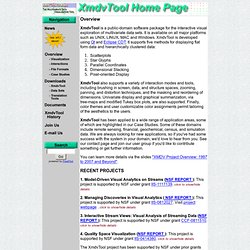
It is available on all major platforms such as UNIX, LINUX, MAC and Windows. http://davis.wpi.edu/~xmdv/index.html