
Regression with SAS: Chapter 1 - Simple and Multiple Regression. Regression with SAS Chapter 1 - Simple and Multiple Regression Chapter Outline 1.0 Introduction 1.1 A First Regression Analysis 1.2 Examining Data 1.3 Simple linear regression 1.4 Multiple regression 1.5 Transforming variables 1.6 Summary 1.7 For more information 1.0 Introduction This web book is composed of four chapters covering a variety of topics about using SAS for regression.
We should emphasize that this book is about "data analysis" and that it demonstrates how SAS can be used for regression analysis, as opposed to a book that covers the statistical basis of multiple regression. We assume that you have had at least one statistics course covering regression analysis and that you have a regression book that you can use as a reference (see the Regression With SAS page and our Statistics Books for Loan page for recommended regression analysis books). 1.1 A First Regression Analysis Let's dive right in and perform a regression analysis using the variables api00, acs_k3, meals and full. Www.ats.ucla.edu/stat/sas/library/exact.pdf. Choosing the Correct Statistical Test in SAS. What statistical analysis should I use?
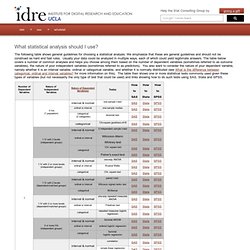
The following table shows general guidelines for choosing a statistical analysis. We emphasize that these are general guidelines and should not be construed as hard and fast rules. Usually your data could be analyzed in multiple ways, each of which could yield legitimate answers. The table below covers a number of common analyses and helps you choose among them based on the number of dependent variables (sometimes referred to as outcome variables), the nature of your independent variables (sometimes referred to as predictors). You also want to consider the nature of your dependent variable, namely whether it is an interval variable, ordinal or categorical variable, and whether it is normally distributed (see What is the difference between categorical, ordinal and interval variables? This page was adapted from Choosing the Correct Statistic developed by James D. Statistical Tests in SAS. Wilcoxon_rank_sum test: SAS instruction. The Wilcoxon rank-rum test (Wilcoxon Mann-Whiney U-test, or WMW test) A common experiment design is to have a test and control conditions.
A two sample t-test would have been a good choice if the test and control groups are independent and follow Normal distribution. If conditions are not met, nonparametric test methods are needed. This section covers one such test, called Wilcoxon rank-sum test (equivalent to the Mann-Whiney U-test) for two samples. The test is preferred when: Comparing two samples. Analyzing the data with WMW test Consider the following example.
The question is to test whether the gap and growth areas do not differ with respect to soil respiration. Soil respiration(continuous) ~ location group (categorical: 2 levels) The data is "soil.csv". Open the data set from SAS. Data soil; infile "H:\sas\data\soil.csv" dlm=',' firstobs=2; input group $ resp; run; Www.stanford.edu/~kcobb/stats210/SAS LAB FOUR.pdf. Annotated SAS Output: Regression. SAS Annotated Output Regression Analysis This page shows an example regression analysis with footnotes explaining the output.
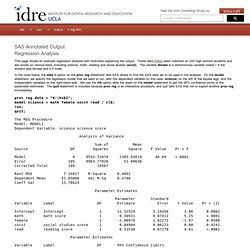
These data (hsb2) were collected on 200 high schools students and are scores on various tests, including science, math, reading and social studies (socst). The variable female is a dichotomous variable coded 1 if the student was female and 0 if male. In the code below, the data = option on the proc reg statement tells SAS where to find the SAS data set to be used in the analysis. On the model statement, we specify the regression model that we want to run, with the dependent variable (in this case, science) on the left of the equals sign, and the independent variables on the right-hand side.
Proc reg data = "d:\hsb2"; model science = math female socst read / clb; run; quit; The REG Procedure Model: MODEL1 Dependent Variable: science science score Analysis of Variance Sum of Mean Source DF Squares Square F Value Pr > F Parameter Estimates Anova Table. SAS Topics: Logistic. Annotated SAS Output: Regression. Www.ats.ucla.edu/stat/sas/library/powersamplesize.pdf. Support.sas.com/rnd/app/stat/papers/plsex.pdf. Www.math.wpi.edu/saspdf/stat/chap51.pdf.