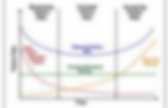
Design of Experiments (DOE) Outline 1.
Introduction The term experiment is defined as the systematic procedure carried out under controlled conditions in order to discover an unknown effect, to test or establish a hypothesis, or to illustrate a known effect. When analyzing a process, experiments are often used to evaluate which process inputs have a significant impact on the process output, and what the target level of those inputs should be to achieve a desired result (output). ICEFA V - Home. Design of Experiments (DOE) PollackSTJ's Channel. Glossary. Design-Expert 8 Manual.
Details Stat-Ease, Inc. welcomes you to version 9 of Design-Expert software (DX9) for design of experiments (DOE).

Use this Windows®-based program to optimize your product or process. It provides many powerful statistical tools, such as: Two-level factorial screening designs: Identify the vital factors that affect your process or product so you can make breakthrough improvements.General factorial studies: Discover the best combination of categorical factors, such as source versus type of raw material supply.Response surface methods (RSM): Find the optimal process settings to achieve peak performance.Mixture design techniques: Discover the ideal recipe for your product formulation.Combinations of process factors, mixture components, and categorical factors: Mix your cake (with different ingredients) and bake it too!
Pallab Dasgupta. Courses: The Dept. of Computer Science & Engineering at I.I.T.

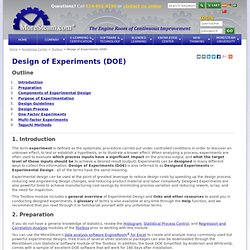
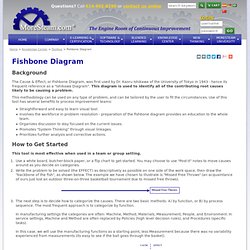
Kharagpur encourages its faculty members to offer a wide range of courses. Typically a faculty member is requested to offer a different course every three years. Distribution: Characteristics of the Weibull Distribution. Characteristics of the Weibull Distribution In the last several issues of Reliability HotWire, we looked at how distributions are defined and how common reliability metrics are derived.
In this issue, we will take a closer look at a specific distribution that is widely used in life data analysis - the Weibull distribution. Named for its inventor, Waloddi Weibull, this distribution is widely used in reliability engineering and elsewhere due to its versatility and relative simplicity. As was discussed in February's Reliability Basics, a distribution is mathematically defined by its pdf equation. The most general expression of the Weibull pdf is given by the three-parameter Weibull distribution expression, or: Study Skills (The University of Manchester) JIPM. 5.3.3.6. Response surface designs. Conveyors and Accumulation Tables » Blog Archive » Conveyor Speed Calculation. We are often asked for recommended speed settings for our conveyors and accumulation tables. Here are some handy formulas to use for converting product rates to chain speeds and the frequencies of the variable frequency drives (VFDs) that power them. The Cause and Effect, or Fishbone Diagram.
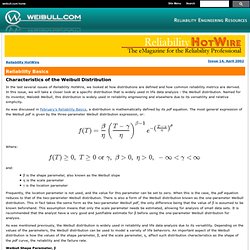
Background The Cause & Effect, or Fishbone Diagram, was first used by Dr.
Kaoru Ishikawa of the University of Tokyo in 1943 - hence its frequent reference as a "Ishikawa Diagram". This diagram is used to identify all of the contributing root causes likely to be causing a problem. This methodology can be used on any type of problem, and can be tailored by the user to fit the circumstances. LeadingThoughts - Quotes on Perseverance - LeadershipNow.com.
"No person was ever honored for what he received.
Honor has been the reward for what he gave. " "You have not lived today until you have done something for someone who can never repay you. " — John Bunyon "If you stand up and be counted, from time to time you may get yourself knocked down. But remember this: A man flattened by an opponent can get up again. Design of Experiments (DOE) Tutorial, Training Course, Seminar, Class: RS 588 Experiment Design and Analysis. The G588 training seminar begins with the fundamentals of Design of Experiments (DOE) methods and continues with advanced concepts, principles and requirements.
The training course presents concepts and software tools that you could use to help your organization: Design experiments that are effective for studying the factors that may affect a product or process. Analyze experimental results in order to identify the significant factors and evaluate ways to improve and optimize the design. Go beyond traditional DOE techniques in order to apply the proper analysis treatment for the response information that is often of interest to reliability engineers — product lifetime data.
Detailed Course Outline Introduction, Background and Overview. Experimental Design. DOE Overview Experiments in Science and Industry Experimental methods are widely used in research as well as in industrial settings, however, sometimes for very different purposes.
The primary goal in scientific research is usually to show the statistical significance of an effect that a particular factor exerts on the dependent variable of interest (for details concerning the concept of statistical significance see Elementary Concepts). In industrial settings, the primary goal is usually to extract the maximum amount of unbiased information regarding the factors affecting a production process from as few (costly) observations as possible. Differences in Techniques These differences in purpose have a profound effect on the techniques that are used in the two settings. This comparison can be expanded further, however, a more detailed description of experimental design in industry will now be discussed and other differences will become clear.
Overview. Product Development Process in Engineering Design. 5-Why Analysis Method Tool. The 5-Why analysis method is used to move past symptoms and understand the true root cause of a problem.
It is said that only by asking "Why? " five times, successively, can you delve into a problem deeply enough to understand the ultimate root cause. By the time you get to the 4th or 5th why, you will likely be looking squarely at management practices. iPresentation_tutorials_from_Reliabilityweb.com_for_maintenance_and_reliability_professionals. Analysis of Variance (ANOVA) Analysis of Variance (ANOVA) Purpose The reason for doing an ANOVA is to see if there is any difference between groups on some variable. For example, you might have data on student performance in non-assessed tutorial exercises as well as their final grading.
3.2.3. Analysis of Variance Models (ANOVA)