
PowerPivot Overview. PowerPivot for SharePoint is a Analysis Services server configured for SharePoint mode.
Where to begin: PowerPivot for Excel. Just What Are Cubes Anyway? (A Painless Introduction to OLAP Technology) Carl Dubler and Colin Wilcox Microsoft Corporation April 2002 Applies to: Microsoft® Excel 2002 Summary: This quick and easy introduction to OLAP databases shows you the differences between traditional Online Transaction Processing (OLTP) databases and Online Analytic Processing (OLAP) databases and how to access OLAP databases from your Office solutions. (8 printed pages) Contents Chances are your business uses at least one database, and probably more.

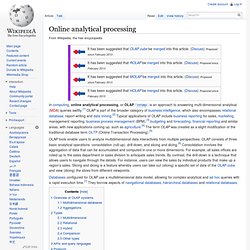
You may not know it, but your OLTP data contains a wealth of information that can help you make informed decisions about your business. The process of analyzing your data for that type of information, and the data that results, are collectively called business intelligence. What were the total sales of all products last year? However, you can spend a lot of time and money trying to extract business intelligence information from your database. The following sections provide an overview of both types of databases. Online analytical processing. In computing, online analytical processing, or OLAP /ˈoʊlæp/, is an approach to answering multi-dimensional analytical (MDA) queries swiftly.[1] OLAP is part of the broader category of business intelligence, which also encompasses relational database, report writing and data mining.[2] Typical applications of OLAP include business reporting for sales, marketing, management reporting, business process management (BPM),[3] budgeting and forecasting, financial reporting and similar areas, with new applications coming up, such as agriculture.[4] The term OLAP was created as a slight modification of the traditional database term OLTP (Online Transaction Processing).[5]
What is OLAP? - mobile wiseGEEK. OLAP cube. An example of an OLAP cube An OLAP cube is an array of data understood in terms of its 0 or more dimensions.
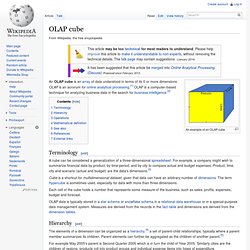
OLAP is an acronym for online analytical processing.[1] OLAP is a computer-based technique for analyzing business data in the search for business intelligence.[2] Terminology[edit] A cube can be considered a generalization of a three-dimensional spreadsheet. For example, a company might wish to summarize financial data by product, by time-period, and by city to compare actual and budget expenses. Each cell of the cube holds a number that represents some measure of the business, such as sales, profits, expenses, budget and forecast. Excel Pivot Table Tutorial for Excel 2007. Using Pivot Tables and Pivot Charts in Microsoft Excel. Pivot Tables. Excel Pivot Table Example Downloads & Tutorials. ShareThis | | Information Helpful?
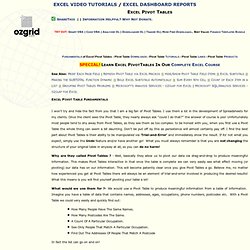
Why Not Donate. TRY OUT: Smart-VBA | Code-VBA | Analyzer-XL | Downloader-XL | Trader-XL| More Free Downloads.. Best Value: Finance Templates Bundle. Create a Pivot Table in Excel 2007. Preparing Your Pivot Table Data Creating a Simple Pivot Table Adding Fields to the Pivot Table Modifying the Pivot Table Test an Interactive Pivot Table Download the Sample File Video: Create a Pivot Table More Pivot Table Tutorials These instructions are for Excel 2013.
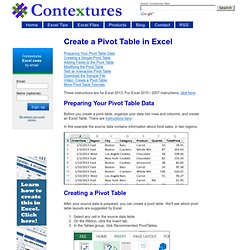
For Excel 2010 / 2007 instructions, click here. Preparing Your Pivot Table Data Before you create a pivot table, organize your data into rows and columns, and create an Excel Table. There are instructions here. In this example the source data contains information about food sales, in two regions. Excel Pivot Table Tutorial. In an Excel Pivot Table, you can use custom calculations to summarize the data, by using the values in other cells in the Values area.
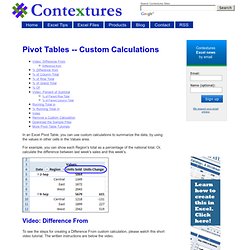
For example, you can show each Region's total as a percentage of the national total. Or, calculate the difference between last week's sales and this week's. Video: Difference From To see the steps for creating a Difference From custom calculation, please watch this short video tutorial. The written instructions are below the video. Difference from You can use the Difference From custom calculation to subtract one pivot table value from another, and show the result. To change the total to a Difference From calculation, follow these steps: Right-click one of the Units value cells, and click Show Values As Click Difference From In the Show Values As dialog box, from the Base field list, choose Date.
Click the OK button, and the pivot table shows the differences in weekly sales. Excel Pivot Tables. Microsoft Excel Pivot Table. Excel 2010 PivotTable What-If Analysis (Writeback) Thanks to Diego Oppenheimer for putting together this post.
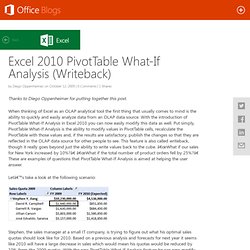
When thinking of Excel as an OLAP analytical tool the first thing that usually comes to mind is the ability to quickly and easily analyze data from an OLAP data source. With the introduction of PivotTable What-If Analysis in Excel 2010 you can now easily modify this data as well. Put simply, PivotTable What-If Analysis is the ability to modify values in PivotTable cells, recalculate the PivotTable with those values and, if the results are satisfactory, publish the changes so that they are reflected in the OLAP data source for other people to see. This feature is also called writeback, though it really goes beyond just the ability to write values back to the cube. “What if our sales for New York increased by 10%? € “What if the total number of product orders fell by 25%? Let’s take a look at the following scenario: So here is what his PivotTable looks like after calculating with the changes: Advanced Options.
Pivot Table Data Crunching: Microsoft® Excel® 2010 > Advanced Pivot Table Tips and Techniques - Pg. 311. Excel 2010: Pivot Tables in Depth—Introducing PowerPivot Normalize Data for Excel Pivot Table.