
Quantum GIS Training. Quantum GIS (QGIS) Training Courses - Lutra Consulting. Home Training Quantum GIS Whether you're a seasoned GIS user or new to GIS, this course will allow you to quickly get to grips with Quantum GIS for both simple and more complex tasks. Key Skills Participants will acquire the following key skills: Commercial Support. Wenn Sie planen QGIS in Ihrer Firma oder Organisation einzusetzen, aber machen sich Sorgen, daß es keine kommerzielle Unterstützung gibt? Hier ist eine alphabetische, in Kategorien aufgeteilte Liste von Supportfirmen. Bemerkung Wir übernehmen nur für die Richtigkeit, Zuverlässigkeit oder Vollständigkeit der Informationen zum Kern Beitragenden. Zum Kern Beitragende. QGIS Server on Ubuntu Step-by-step « Free and Open Source GIS Ramblings. This post summarizes my notes about installing QGIS Server on Ubuntu, adding a QGIS project file to the server and using the WMS in an OpenLayers application.
Installation First, it’s useful to figure out the Ubuntu version: QGIS Plugin of the Week: Time Manager. QGIS has a lot of plugins, including over 180 that have been contributed by users. If you aren’t using plugins, you are missing out on a lot that QGIS has to offer. I’m starting what I hope to be a regular feature: Plugin of the Week. This week we’ll take a look at Time Manager.
Time Manager lets you browse spatial data that has a temporal component. Essentially this includes anything that changes location through time. Wildlife trackingVehiclesStorm centersQGIS users. Exporting QGIS to Illustrator. QGIS Styling Vector Data. Please see Basic Vector Styling for an updated version of this tutorial.
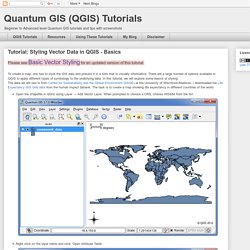
To create a map, one has to style the GIS data and present it in a form that is visually informative. There are a large number of options available in QGIS to apply different types of symbology to the underlying data. In this tutorial, we will explore some basics of styling.The data we will use is from Center for Sustainability and the Global Environment (SAGE) at the University of Wisconsin-Madison. I downloaded the Life Expectancy GIS Grid data from the human impact dataset. The task is to create a map showing life expectancy in different countries of the world.Open the shapefile in QGIS using Layer → Add Vector Layer. We will explore many more options and the Rule-based styling method in a subsequent tutorial.
Create legend with LegendSVG. Getting Started With QGIS: Open Source GIS. Learn GIS. Branner Library is committed to support and enhance geospatial teaching and research at Stanford University. In collaboration with other institutions and departments, such as Google Outreach, we offer a number of different training seminars and workshops that range from basic mapping techniques to advanced spatial analysis and web mapping applications. Workshops are scheduled on an as-needed basis so the day and time they are offered will vary each week. Please visit the GIS Workshops website to register for any of our workshops. All of our workshops are free for the Stanford community, and seats are filled on a first-come, first-served basis according to the time of registration online. We continue to add new workshops every month, and appreciate your suggestions.
Neogeo ramblings with a Python twist. Occasionally you just need a quick map, and it’s not going to be used for interaction or even necessarily display on the internet (say a Keynote/PowerPoint presentation, for example). We could build it as a Google map, get a gigantic computer monitor and fullscreen the window and take a screenshot, and have it look like every other web map out there – or we can reach into the toolbox of those who are NOT neogeographers and borrow a few things. QGIS basics for Journalists. QGIS export happens in the print dialog box.
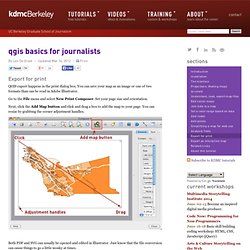
You can save your map as an image or one of two formats than can be read in Adobe Illustrator. Go to the File menu and select New Print Composer. Set your page size and orientation. Next, click the Add Map button and click and drag a box to add the map to your page. You can resize by grabbing the corner adjustment handles. Working with Raster Data — QGIS User Guide 1.7.4 documentation. QGIS Raster to vector and Change projection. —Contribute to this tutorial by completing one section welcome !
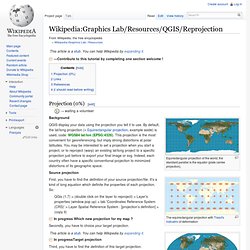
Projection (0%)[edit] → waiting a volunteer Equirectangular projection of the world; the standard parallel is the equator (plate carrée projection). Background QGIS display your data using the projection you tell it to use. Source projection First, you have to find the definition of your source projection/file. Opening raster files. QGIS understands three major forms of data.
Two of these are spatial (ie, they contain information allows it to be shown in space) and the third contains no spatial data (" aspatial data") The two spatial data types are: Vector data. Vector data can be drawn by lines of varying lengths; that is points, lines or polygons. In QGIS vector files can only contain one of these three types in a file. Raster data. Digitizing Errors in GIS. Digitizing in GIS is the process of converting geographic data either from a hardcopy or a scanned image into vector data by tracing the features.
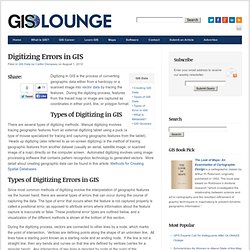
During the digitzing process, features from the traced map or image are captured as coordinates in either point, line, or polygon format. Types of Digitizing in GIS There are several types of digitizing methods. Manual digitizing involves tracing geographic features from an external digitizing tablet using a puck (a type of mouse specialized for tracing and capturing geographic features from the tablet). Heads up digitizing (also referred to as on-screen digitizing) is the method of tracing geographic features from another dataset (usually an aerial, satellite image, or scanned image of a map) directly on the computer screen.
Quantum GIS (QGIS) Tutorials. QGIS Working with Attribute Table. Stamen Maps for QGIS. Stamen’s maps are amongst the most creative and beautiful OpenStreetMap visualizations and it would be great to have them as base maps in QGIS.
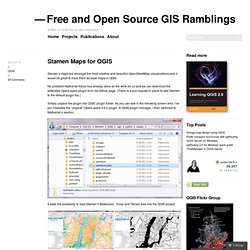
No problem! Nathaniel Kelso has already done all the work for us and we can download the extended OpenLayers plugin from his Github page. (There is a pull request in place to add Stamen to the default plugin too.) Simply unpack the plugin into QGIS’ plugin folder. As you can see in the following screen shot, I’ve put it besides the “original” OpenLayers 0.6.2 plugin. It adds the possibility to load Stamen’s Watercolor, Toner and Terrain tiles into the QGIS project: QGIS Using Tabular Data. Teach Yourself GIS vs. Being "Led" I learned about a URISA-hosted seminar titled "Maps in the Cloud" held last week (Nov 17).
The details on the $20 session are: Bring your WI-FI enabled laptop to participate in a hands on workshop showing you how to create intelligent web maps without having any GIS software installed on your computer. Esri technical staff will lead participants through a series of exercises that utilize the latest capabilities of ArcGIS.Com. I found a very experienced GIS person who attended. He posted the map he made on his blog. HTML map tips in QGIS « Nathans QGIS and GIS blog.