
Comparison of Desktop GIS (matrix3) Open Source GIS. Underdark. If you are looking for a tool to easily create 3D visualizations of your geodata, look no further!
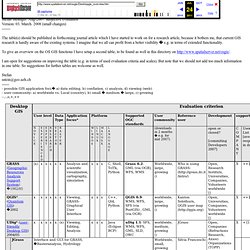
Qgis2threejs is a plugin by Minoru Akagi which exports terrain data combined with the map canvas image and optional vector data to an html file which can be viewed in 3D in any web browser which supports WebGL. To do that, this plugin uses the Three.js library. This is the result of my first experiments with Qgis2threejs. In the following sections, I will show the steps to reproduce it. click for the interactive version (requires WebGL-capable browser) 1. The building blocks of this visualization are: elevation data and the hillshade derived from this dataa base map (WMTS from basemap.at in my case)OSM building data provided by Geofabrik andtree data from the city of Vienna Load all datasets into QGIS. 2. Qgis2threejs will overlay the map (as rendered in the QGIS map area) on top of the elevation model. 3.
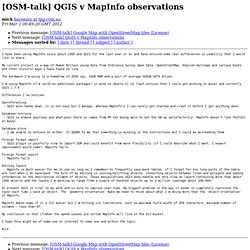
The vector features in the visualization are buildings and trees. 4. That’s it! Desktop GIS. Stefan Steiniger: Aug-2007: subjective evaluation Version: 03.
March. 2008 (small changes) The table(s) should be published in forthcoming journal article which I have started to work on for a research article, because it bothers me, that current GIS research is hardly aware of the existing systems. I imagine that we all can profit from a better visibility e.g. in terms of extended functionality. To give an overview on the OS GIS functions I have setup a second table, to be found as well in this directory on I am open for suggestions on improving the table (e.g. in terms of used evaluation criteria and scales). Stefan sstein@geo.uzh.ch - possible GIS application foci: a) data editing, b) conflation, c) analysis, d) viewing (web) - user community: a) worldwide vs.
. - evaluation scale: --,-,o,+,++ *) strong development activities: application focus may change. uDig : Home. QGIS v MapInfo observations. Mick bareman at tpg.com.au Fri Mar 2 00:49:20 GMT 2012 I have been using MapInfo since about 1995 and QGIS for the last year or so and have noticed some real differences in usability that I would like to share.
My current project is a map of Roman Britain using data from Ordinance Survey Open Data, OpenStreetMap, English Heritage and various books and other historic maps I have found on line. The hardware I'm using is a homebrew i5 2500 cpu, 16GB RAM and a pair of average 500GB SATA drives. I'm using MapInfo v7.8 (with no additional packages) in wine on Ubuntu 11.10 (last version that I could get working in wine) and currently QGIS 1.7.4 Differences I've noticed: Georeferencing - QGIS wins hands down, it is not easy but I manage, whereas MapInfo's I can rarely get started and crash it before I get anything done. Database retrieve - QGIS is almost painless and what pain there is comes from MY not being able to set the DB up satisfactorily.
More information about the talk mailing list. MapWindow. Documentation [MapWindow] 52°North OS Geo soft. Portal. Portal. GvSIG Quickstart — OSGeo-Live 5.5 Documentation. GvSIG is a Geographic Information System (GIS), that is, a desktop application designed for capturing, storing, handling, analyzing and deploying any kind of referenced geographic information in order to solve complex management and planning problems. gvSIG is known for having a user-friendly interface, being able to access the most common formats, both vector and raster ones.
It features a wide range of tools for working with geographic-like information (query tools, layout creation, geoprocessing, networks, etc.), which turns gvSIG into the ideal tool for users working in the land realm. This quickstart describes how to... Add projection, raster and vector data to a viewNavigate aroundChange layersSelect featuresCreate a map with a graticuleSave the project and exit gvSIGInstall an add-on (OpenStreetMap service)Load a WTMS layer Note If gvSIG user interface becomes unresponsive, try Alt+f to open the file menu for example.
Start gvSIG and create a view Define the projection of your view.