
Game theory and the Cuban missile crisis. January 2001 Theory of Moves "We're eyeball to eyeball, and I think the other fellow just blinked" were the eerie words of Secretary of State Dean Rusk at the height of the Cuban missile crisis in October 1962.

He was referring to signals by the Soviet Union that it desired to defuse the most dangerous nuclear confrontation ever to occur between the superpowers, which many analysts have interpreted as a classic instance of nuclear "Chicken". Chicken is the usual game used to model conflicts in which the players are on a collision course. The players may be drivers approaching each other on a narrow road, in which each has the choice of swerving to avoid a collision or not swerving. While ostensibly a game of Chicken, the Cuban missile crisis is in fact not well modelled by this game. On the other hand, the "theory of moves," which is founded on game theory but radically changes its standard rules of play, does retrodict, or make past predictions of, the leaders' choices.
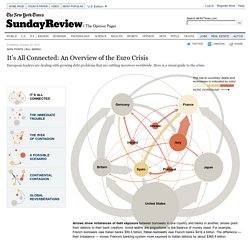
Booki. An Overview of the Euro Crisis - Interactive Graphic. Arrows show imbalances of debt exposure between borrowers in one country and banks in another; arrows point from debtors to their bank creditors.

Arrow widths are proportional to the balance of money owed. For example, French borrowers owe Italian banks $50.6 billion; Italian borrowers owe French banks $416.4 billion. The difference — their imbalance — shows France's banking system more exposed to Italian debtors by about $365.8 billion. The risk to countries’ debts and economies is indicated by color: More worrisome Greece amassed a huge debt that it has scant hope of repaying. If there is no firewall or if it is inadequate, it would be easy to imagine a run on banks.
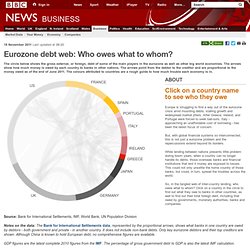
If no preventative measures are taken, a chain of events like this could unfold: In reaction to a Greek collapse, investors become worried about their exposure to other risks in the region. Italy may not be able to protect its banks if there is a loss of confidence. Eurozone debt web: Who owes what to whom? The circle below shows the gross external, or foreign, debt of some of the main players in the eurozone as well as other big world economies.

The arrows show how much money is owed by each country to banks in other nations. The arrows point from the debtor to the creditor and are proportional to the money owed as of the end of June 2011. The colours attributed to countries are a rough guide to how much trouble each economy is in. Click on a country name to see who they owe Europe is struggling to find a way out of the eurozone crisis amid mounting debts, stalling growth and widespread market jitters.
But, with global financial systems so interconnected, this is not just a eurozone problem and the repercussions extend beyond its borders. While lending between nations presents little problem during boom years, when a country can no longer handle its debts, those overseas banks and financial institutions that lent it money are exposed to losses. GDP: €1.8 tn Foreign debt: €4.2 tn. Www.hrbartender.com/images/thinking.pdf. Poll: Which methods/algorithms did you use for data analysis in 2011? Regional breakdown is US/Canada, 40.2% Europe, 37.6% Asia, 10.3% Latin America, 5.8% Africa/Middle East, 3.2% Australia/NZ 2.9% We grouped Industry/Gov in one group and Academic researchers/Students into a second group, and computed the "affinity" of the algorithm to Industry/Gov as N(Alg,Ind_Gov) / N(Alg,Aca_Stu) ---------------------------------- N(Ind_Gov) / N(Aca_Stu) Thus algorithm with affinity 1.5 is used 50% more in Industry/Government than by Academic Researchers or students, and the algorithm with affinity 0.6 is used only 60% as much in Industry.

The most "industrial" algorithms ( with the highest Industry / Gov "affinity") are: Uplift modeling, INF (no academic users) Survival Analysis, 2.47 Regression, 2.00 The most "academic" algorithms ( with the lowest Industry / Gov "affinity") are: Genetic algorithms, 0.60 Support Vector (SVM), 0.66 Association Rules, 0.83 The following table shows the algorithms ranked by Industry affinity (third column).