
Confusing Stats Terms Explained: Residual — Stats Make Me Cry. When I hear the word "residual", the pulp left over after I drink my orange juice pops into my brain, or perhaps the film left on the car after a heavy rain.
However, when my regression model spits out an estimate of my model's residual, I'm fairly confident it isn't referring to OJ or automobile gunk...right? Not so fast, that imagery is more similar to it's statistical meaning than you might initially think. In statistics, a residual refers to the amount of variability in a dependent variable (DV) that is "left over" after accounting for the variability explained by the predictors in your analysis (often a regression). Right about now you are probably thinking: "this guy likes the word "variability" way too much, he should buy a thesaurus already!
" Keep in mind that each person in your sample will have their own residual score. Like the imagery of the orange pulp, a statistical residual is simply what's left over from your regression model. Least-Squares Regression Line. Statistics Glossary - presenting data. Discrete Data A set of data is said to be discrete if the values / observations belonging to it are distinct and separate, i.e. they can be counted (1,2,3,....).
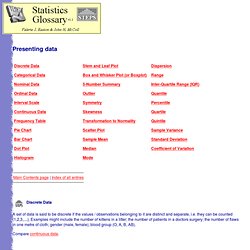
Examples might include the number of kittens in a litter; the number of patients in a doctors surgery; the number of flaws in one metre of cloth; gender (male, female); blood group (O, A, B, AB). Compare continuous data. Categorical Data A set of data is said to be categorical if the values or observations belonging to it can be sorted according to category. Categories should be chosen carefully since a bad choice can prejudice the outcome of an investigation. Nominal Data A set of data is said to be nominal if the values / observations belonging to it can be assigned a code in the form of a number where the numbers are simply labels. Ordinal Data A set of data is said to be ordinal if the values / observations belonging to it can be ranked (put in order) or have a rating scale attached.
Interval Scale Continuous Data Frequency Table. Statistics: Index - MathWiki. Central Limit Theorem. Normal distribution. In probability theory, the normal (or Gaussian) distribution is a very commonly occurring continuous probability distribution—a function that tells the probability that an observation in some context will fall between any two real numbers.
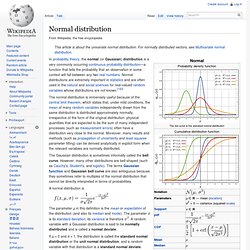
Normal distributions are extremely important in statistics and are often used in the natural and social sciences for real-valued random variables whose distributions are not known.[1][2] The normal distribution is immensely useful because of the central limit theorem, which states that, under mild conditions, the mean of many random variables independently drawn from the same distribution is distributed approximately normally, irrespective of the form of the original distribution: physical quantities that are expected to be the sum of many independent processes (such as measurement errors) often have a distribution very close to the normal. The Gaussian distribution is sometimes informally called the bell curve.
Mean Median & Mode Math Learning Upgrade. Normal Distribution Video. Correlation and Regression. Normal Distribution (Part 1) Normal Distribution (Part 2)