
Regression. Correlation Analysis. PCA and Multivariate analysis. Correspondence Analysis (CA) Structural Equation Modeling (SEM) Multivariate Analsysis. Linear Algebra and Matrix. Math Models. Game Theory. Simulation Optimization Solving Problems. OpenOpt. OpenOpt is a framework for numerical optimization, nonlinear equations and systems of them.
Part of it is licensed under the open source BSD license, but it uses proprietary software for some of its functionality and its stochastic optimization add-on is proprietary as well. Originally developed in MATLAB, OpenOpt is now developed in Python, using NumPy for numerical work. ralg for medium-scaled nonlinear/nonsmooth problems (number of variables ~1500)gsubg for large-scaled nonlinear/nonsmooth problemsinteralg - can obtain optimum with guarantied precision and all solutions of nonlinear equations system, can handle categorical variables, general logical constraints, multiobjective problems OpenOpt also has OpenOpt-connected solvers can have any type of license, but are primarily open source and OSI-approved ones such as GPL, LGPL, and BSD. Along with FuncDesigner, OpenOpt Suite also includes. Systems theory.
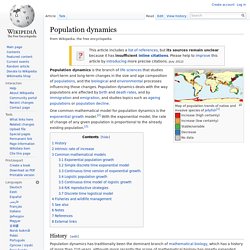
Population dynamics. Map of population trends of native and invasive species of jellyfish[1] Increase (high certainty) Increase (low certainty) Stable/variable Decrease No data.
Ludwig von Bertalanffy. Karl Ludwig von Bertalanffy (September 19, 1901, Atzgersdorf near Vienna – June 12, 1972, Buffalo, New York) was an Austrian-born biologist known as one of the founders of general systems theory (GST).
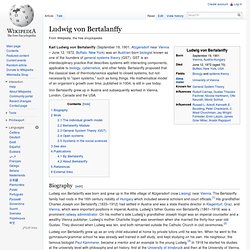
GST is an interdisciplinary practice that describes systems with interacting components, applicable to biology, cybernetics, and other fields. Bertalanffy proposed that the classical laws of thermodynamics applied to closed systems, but not necessarily to "open systems," such as living things. His mathematical model of an organism's growth over time, published in 1934, is still in use today.
Von Bertalanffy grew up in Austria and subsequently worked in Vienna, London, Canada and the USA. Biography[edit] Ludwig von Bertalanffy grew up as an only child educated at home by private tutors until he was ten. Work[edit] Hubbert curve. The Hubbert curve is an approximation of the production rate of a resource over time.
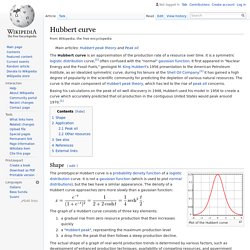
It is a symmetric logistic distribution curve,[1] often confused with the "normal" gaussian function. It first appeared in "Nuclear Energy and the Fossil Fuels," geologist M. King Hubbert's 1956 presentation to the American Petroleum Institute, as an idealized symmetric curve, during his tenure at the Shell Oil Company.[1] It has gained a high degree of popularity in the scientific community for predicting the depletion of various natural resources. Gompertz function. A Gompertz curve or Gompertz function, named after Benjamin Gompertz, is a sigmoid function. It is a type of mathematical model for a time series, where growth is slowest at the start and end of a time period.
The right-hand or future value asymptote of the function is approached much more gradually by the curve than the left-hand or lower valued asymptote, in contrast to the simple logistic function in which both asymptotes are approached by the curve symmetrically. It is a special case of the generalised logistic function. Formula[edit] where Differentiation[edit] The function curve can be derived from a Gompertz law of mortality, which states the rate of mortality (decay) falls exponentially with current size. Is the rate of growth.k is an arbitrary constant. Example uses[edit] Mathematical model. Exponential function. The natural exponential function The graph of y = ex is upward-sloping, and increases faster as x increases.
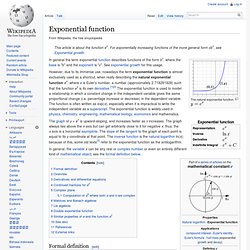
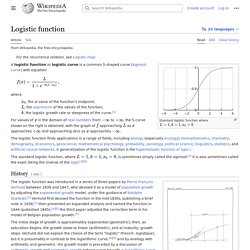
The graph always lies above the x-axis but can get arbitrarily close to it for negative x; thus, the x-axis is a horizontal asymptote. The slope of the tangent to the graph at each point is equal to its y coordinate at that point. Logistic function. Standard logistic sigmoid function A logistic function or logistic curve is a common "S" shape (sigmoid curve), with equation: where.
Logistic process - JSXGraph Wiki. E (mathematical constant) Functions f(x) = ax are shown for several values of a. e is the unique value of a, such that the derivative of f(x) = ax at the point x = 0 is equal to 1.
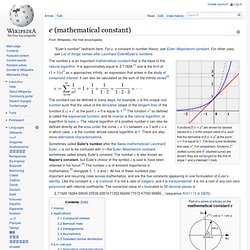
The blue curve illustrates this case, ex. For comparison, functions 2x (dotted curve) and 4x (dashed curve) are shown; they are not tangent to the line of slope 1 and y-intercept 1 (red). 2.71828182845904523536028747135266249775724709369995... (sequence A001113 in OEIS). The first references to the constant were published in 1618 in the table of an appendix of a work on logarithms by John Napier.[6] However, this did not contain the constant itself, but simply a list of logarithms calculated from the constant. The first known use of the constant, represented by the letter b, was in correspondence from Gottfried Leibniz to Christiaan Huygens in 1690 and 1691. The effect of earning 20% annual interest on an initial $1,000 investment at various compounding frequencies An account starts with $1.00 and pays 100 percent interest per year. 1.
Entropy, Redundancy and Inequality Measures. RIPSA - Rede Interagencial de Informações para a Saúde.