
EarthquakeDensityMap. Comprendre l'accident de Fukushima en 3 minutes. Google Maps: Relevés de l'équipe de Greenpeace dans la Préfecture de Fukushima. Google Maps: Cartographie du niveau de radiation au Japon. Japan Quake Map - Earthquakes in the past 7 days. "Apocalypse" au Japon. Accidents nucléaires au Japon. Modélisation de la dispersion des rejets radioactifs dans l'atmosphère à l'échelle globale. MapAction. Japan Earthquake Map – How Japan Shifted. Japan Earthquake Graphic: Where the wave hit. 1063-NucleaireMonde-1000. Séisme au Japon: Une cartographie de synthèse intéressante. Suite au séisme du 11 mars au Japon, de nombreuses cartes en ligne ont été publiées avec la localisation du séisme et des informations associées.
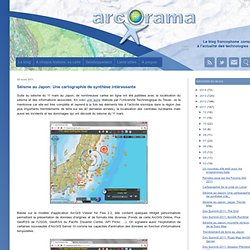
En voici une autre réalisée par l'Université Technologique du Texas. Je la mentionne car elle est très complète et reprend à la fois les éléments liés à l'activité sismique dans la région (les plus importants tremblements de terre sur les 40 dernières années), la localisation des centrales nucléaires mais aussi les incidents et les dommages qui ont découlé du séisme du 11 mars. Basée sur le modèle d'application ArcGIS Viewer for Flex 2.2, elle contient quelques Widget personnalisés permettant la présentation de données d'origines et de formats très diverses (Fonds de carte ArcGIS Online, Flux GeoRSS de l'USGS, GeoRSS du Pacific Disaster Center, API Flickr, …).
On signalera aussi l'exploitation de certaines nouveautés d'ArcGIS Server 10 comme les capacités d'animation des données en fonction d'informations temporelles. 2011 March 11 Off Tohoku-Pacific Tsunami. Poster of the Great Tohoku Earthquake (northeast Honshu, Japan) of March 11, 2011 - Magnitude 9.0. Sciences : Le panache radoactif japonais modélisé par des scientifiques. INFOGRAPHIE - En partenariat avec l'Agence internationale de l'énergie atomique, des météorologues autrichiens ont déterminé l'évolution probable dans le Pacifique des «nuages» d'iode 131 et de césium 137 émis à Fukushima.

Visualiser le danger pour rationnaliser la peur. C'est probablement l'objectif de l'Agence internationale de l'énergie atomique (AIEA) basée à Vienne qui a fait appel à des météorologues autrichiens (ZAMG) pour modéliser le panache radioactif qui s'échappe de la centrale nucléaire de Fukushima depuis samedi. On peut désormais visualiser l'évolution de ce «nuage» radioactif invisible sous deux formes : sa concentration en iode 131 à proximité du Japon et en césium 137, deux particules radioactives, depuis samedi jusqu'à vendredi matin.
L'iode 131 est un élément très radioactif sur une courte période de temps puisque sa durée de demi-vie* est de 8 jours. Si cet isotope de l'iode ne «vit» pas très longtemps, ses effets sur la santé sont dévastateurs. Le Figaro - Santé : Comprendre la radioactivité en cinq questions clés. Alors que la situation est loin d'être stabilisée dans les centrales japonaises, Le Figaro fait le point sur le phénomène physique de la radioactivité et explique les conséquences des accidents nucléaires sur la santé humaine. • La radioactivité est-elle une création humaine ou bien existe-t-elle naturellement ?

Oui, la radioactivité existe à l'état naturel. Au cœur des atomes, se trouvent les noyaux. Certains, plus fragiles que d'autres, se brisent spontanément (c'est la fission) en dégageant de l'énergie sous la forme de chaleur et de rayonnements. International : Le Japon dévasté : le film des événements. Petit cours de nucléaire ? L'usage du citoyen curieux. Devant les fantasmes des uns et les minimisations des autres, voici quelques données sur le fonctionnement des réacteur nucléaires endommagés au Japon, et l’évolution possible de la situation.
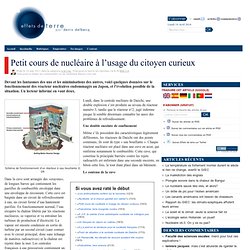
Un lecteur informé en vaut deux. Schéma de fonctionnement d'un réacteur à eau bouillante © DR Lundi, dans la centrale nucléaire de Daiichi, une double explosion s’est produite au niveau du réacteur numéro 3, tandis que le réacteur n°2, jugé indemne jusque là semble désormais connaître lui aussi des problèmes de refroidissement. Japan Quake Map. SeismeTohoku2011. Animation nucléaire japon séisme tsunami catastrophe énergie.
Accident nucléaire au Japon : le suivi météo - Infos de METEO CONSULT - Prévisions à 14 jours. Ce mardi après-midi, un nouveau séisme de magnitude 6 a été enregistré à Shizuoka, à 120 km environ au Sud-Ouest de la capitale.
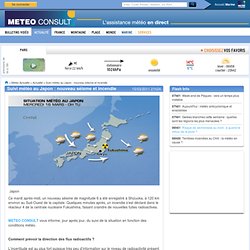
Quelques minutes après, un incendie s'est déclaré dans le réacteur 4 de la centrale nucléaire Fukushima, faisant craindre de nouvelles fuites radioactives. METEO CONSULT vous informe, jour après jour, du suivi de la situation en fonction des conditions météo. Comment prévoir la direction des flux radioactifs ? L’incertitude est au plus fort puisque très peu d’information sur le niveau de radioactivité présent à la source est disponible. Or, pour calculer correctement la propagation et la dispersion du nuage radioactif il faut, comme pour toute modélisation, intégrer la source (quantité, teneur, durée de l’émanation). La menace revient à partir de vendredi Si les rejets persistent, la situation redeviendra encore plus dangereuse. Le scénario de la catastrophe de Fukushima.
L'épicentre du séisme qui a frappé la ville de Sendai, au Japon. Japan earthquake: Interactive map tracks the foreshocks and aftershocks of the 9.0 magnitude quake that struck March 11, 2011. The magnitude 9.0 earthquake that rocked Japan on March 11 at 2:46 p.m. struck after a series of smaller quakes earlier in the week.

Aftershocks — as many as 12 to 15 an hour — now total in the hundreds, including more than 30 of magnitude 6 or greater. Japan Earthquake Map Viewer.
ABC News - Japan Earthquake: before and after. Development: Andrew KesperSource: Google Aerial photos taken over Japan have revealed the scale of devastation across dozens of suburbs and tens of thousands of homes and businesses.
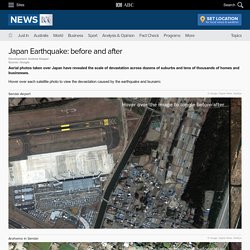
Hover over each satellite photo to view the devastation caused by the earthquake and tsunami. Sendai Airport © Google, Digital Globe, GeoEye Hover over the image to toggle before/after Arahama in Sendai Fujitsuka in Sendai Yuriage in Natori. El mayor terremoto en la historia de Japón produce un 'tsunami' devastador – Terremoto – Noticias, última hora, vídeos y fotos de Terremoto en lainformacion. Un devastador terremoto de 8,9 grados de magnitud en la escala de Richter, seguido de un fuerte tsunami, ha causado este viernes cientos de muertos y al menos 350 desaparecidos en el este de Japón, un país acostumbrado a los temblores pero que nunca había visto nada semejante.

Entre doscientos y trescientos cadáveres fueron hallados en áreas costeras de la ciudad oriental de Sendái, donde muchas zonas residenciales quedaron anegadas a causa de un tsunami que, con olas de hasta 10 metros, ha arrastrado docenas de vehículos y viviendas, según la policía local. Sin embargo, según el Ministerio de Defensa la cifra podría elevarse a más de mil personas porque hay unas 1.800 viviendas destruidas en Minamisoma, en la prefectura de Fukushima, según ha informado la agencia de noticias Kiodo. Desde el ministerio de Defensa afirman que cerca de 1.800 viviendas en la provincia oriental de Fukushima han quedado destruidas, por lo que la cifra final de fallecidos puede superar el millar, según Kyodo. How the nuclear emergency unfolded. Map of the Damage From the Japanese Earthquake. The Crippled Japanese Nuclear Reactors - Interactive Feature. The Crippled Japanese Nuclear Reactors - Interactive Feature.
Chaîne de NOAAPMEL. Politicalprof. Interactive graphic: Japan's deadly seismic history. Japan earthquake - the worst-affected areas. Japan's earthquake history mapped. Japan Earthquake fifth largest earthquake since 1900. In this photo released by Nexco East Japan, a worker inspects a caved-in section of the Joban Motorway near Mito, Ibaraki.

Graphic: Quake devastates Japan, sparks nuclear reactor fears. National PostDigital Access | Sign in | Register today News TRENDINGJim Flaherty | Colbert | Trevor Linden | MH370 | Ultimate Warrior | Ukraine | Peaches Geldof | Quebec election results | Rob Ford | Letterman | Justin Trudeau | Olivia Chow | Canucks | Tim Hortons | BlackBerry Graphic: Quake devastates Japan, sparks nuclear reactor fears Republish Reprint National Post Staff | March 11, 2011 | Last Updated: Mar 14 3:55 PM ETMore from National Post Staff Read our complete coverage here.

This graphic will be updated as more information becomes available. The quake also caused authorities to issue tsunami warnings and advisories across the Pacific, including parts of the B.C. and U.S. west coast. Earlier on Friday, advisories and warnings were issued for large parts of the U.S. and Canada west coast. Graphic: Disaster in Japan — The Quake. Graphic: Disaster in Japan — The Aftermath.