Zoom
Trash

Predictive Is The Next Step In Analytics Maturity? It’s More Complicated Than That! Data Engineering Coming of Age. The data scientist gets much attention as an important role in the age of analytics.
Daten und Statistik: Was ein Data Scientist wirklich können muss. Using SQL Service Broker for asynchronous external script (R / Python) execution in OLTP systems. Authored by Arvind Shyamsundar (Microsoft) Credits: Prasad Wagle, Srinivasa Babu Valluri, Arun Jayapal, Ranga Bondada, Anand Joseph (members of the Sayint by Zen3 team) Reviewers: Nellie Gustafsson, Umachandar Jayachandran, Dimitri Furman (Microsoft) This blog post was inspired our recent work with the Sayint dev team, who are a part of Zen3 Infosolutions.
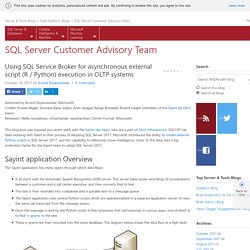
SQLCAT has been working with them in their process of adopting SQL Server 2017. Microsoft introduced the ability to invoke external Python scripts in SQL Server 2017, and this capability to effectively move ‘intelligence’ closer to the data, was a big motivation factor for the Sayint team to adopt SQL Server 2017. Sayint application Overview. Machine Learning Solutions Decision Tree. Machine learning is a technique of data science that helps computers learn from existing data in order to forecast future behaviors, outcomes, and trends.
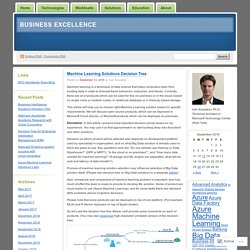
Currently there are lot of products which can be used for this on-premises or in the cloud, based on single node or multiple nodes, in relational database or in Hadoop based storage. This article will help you to choose right Machine Learning solution based on specific requirements. We will discuss open source products, which can be deployed in Microsoft Cloud (Azure), or Microsoft products which can be deployed on-premises. Disclaimer.
Online Book: Analytics with Power BI and R. In 2016, after bringing the capability of writing R codes inside Power BI, I’ve been encouraged to publish an online book through a set of blog posts.
The main reason to publish this book online, was that there is no integrated and comprehensive book on how to use R inside Power BI. From that time till now, I’ve been writing blog posts (or sections) of this book almost weekly in RADACAD blog. So far, I have more than 20 sections wrote in this book. Pictures of Big Data. What are the Big Guys Using? Summary: The largest companies utilizing the most data science resources are moving rapidly toward more integrated advanced analytic platforms.
The features they are demanding are evolving to promote speed, simplicity, quality, and manageability. This has some interesting implications for open source R and Python widely taught in schools but significantly less necessary with these more sophisticated platforms. We continue to be dazzled, and perhaps rightly so, by the advances in deep learning and question answering machines like Watson.
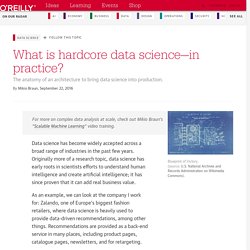
And while these are fun to read about and some of the apps that incorporate them can be both handy and addictive, they cause us to take our eye off the bigger ball. What is hardcore data science—in practice? Data science has become widely accepted across a broad range of industries in the past few years.
What is the difference between Data Science, Data Analysis, Big Data, Data Analytics, Data Mining and Machine Learning? Data Science deals with structured and unstructured data.
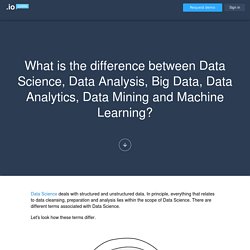
In principle, everything that relates to data cleansing, preparation and analysis lies within the scope of Data Science. There are different terms associated with Data Science. Let's look how these terms differ. Who’s Who In The Booming World Of Data Science » The nature of work and business in today’s super-connected world means that every second of every day, the world produces an astonishing amount of data.
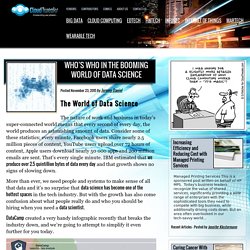
Consider some of these statistics; every minute, Facebook users share nearly 2.5 million pieces of content, YouTube users upload over 72 hours of content, Apple users download nearly 50 000 apps and 200 million emails are sent. That’s every single minute. IBM estimated that we produce over 2.5 quintillion bytes of data every day and that growth shows no signs of slowing down. More than ever, we need people and systems to make sense of all that data and it’s no surprise that data science has become one of the hottest spaces in the tech industry. But with the growth has also come confusion about what people really do and who you should be hiring when you need a data scientist.
DataCamp created a very handy infographic recently that breaks the industry down, and we’re going to attempt to simplify it even further for you today. R vs Python: head to head data analysis. There have been dozens of articles written comparing Python and R from a subjective standpoint.
We’ll add our own views at some point, but this article aims to look at the languages more objectively. We’ll analyze a dataset side by side in Python and R, and show what code is needed in both languages to achieve the same result. This will let us understand the strengths and weaknesses of each language without the conjecture. At Dataquest, we teach both languages, and think both have a place in a data science toolkit. We’ll be analyzing a dataset of NBA players and their performance in the 2013-2014 season. Read in a csv file nba <- read.csv("nba_2013.csv") Python import pandasnba = pandas.read_csv("nba_2013.csv") The above code will load the csv file nba_2013.csv, which contains data on NBA players from the 2013-2014 season, into the variable nba in both languages.
Find the number of players. Choosing R or Python for data analysis? An infographic. I think you'll agree with me if I say: It's HARD to know whether to use Python or R for data analysis.
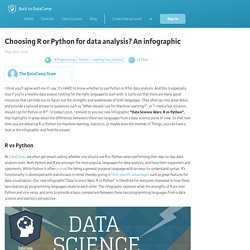
And this is especially true if you're a newbie data analyst looking for the right language to start with. It turns out that there are many good resources that can help you to figure out the strengths and weaknesses of both languages. They often go into great detail, and provide a tailored answer to questions such as "What should I use for Machine Learning? ", or "I need a fast solution, should I go for Python or R? ". RegexOne - Learn Regular Expressions - Lesson 1: An Introduction, and the ABCs.
Microsoft ODBC Driver for SQL Server on Linux. The ODBC driver for SQL Server allows native applications (C/C++) running on Linux to connect to SQL Server 2008, SQL Server 2008 R2, SQL Server 2012, and Microsoft Azure SQL Database. With Microsoft ODBC Driver 13 (Preview) for SQL Server, SQL Server 2014 and SQL Server 2016 (Preview), are now also supported. Always Encrypted The following are answers to questions about the ODBC Driver for SQL Server on Linux. For more information about the driver, see the Microsoft ODBC driver team blog. How do existing ODBC applications on Linux work with the driver? You should be able to compile and run the ODBC applications that you have been compiling and running on Linux using other drivers.
Which features of SQL Server 2012 does this version of the driver support? Does the driver support Kerberos authentication? A Beginner's Guide to Scaling to 11 Million+ Users on Amazon's AWS. How do you scale a system from one user to more than 11 million users? Joel Williams, Amazon Web Services Solutions Architect, gives an excellent talk on just that subject: AWS re:Invent 2015 Scaling Up to Your First 10 Million Users.
If you are an advanced AWS user this talk is not for you, but it’s a great way to get started if you are new to AWS, new to the cloud, or if you haven’t kept up with with constant stream of new features Amazon keeps pumping out. As you might expect since this is a talk by Amazon that Amazon services are always front and center as the solution to any problem. Their platform play is impressive and instructive. It's obvious by how the pieces all fit together Amazon has done a great job of mapping out what users need and then making sure they have a product in that space. Some of the interesting takeaways: Blog - Writings about data science, from the makers of Dataquest.io.
Learn Python The Hard Way (Programmier-Anfängerguide) Making R the Enterprise Standard for Cross-Platform Analytics, Both On-Premises and in the Cloud - Machine Learning. Advanced und Predictive Analytics – woher kommt das große Interesse? Advanced und Predictive Analytics – woher kommt das große Interesse? Die fortgeschrittene Analyse von Daten umfasst einfach gesprochen alles, was über die einfache Darstellung von Daten in Reports oder Dashboards oder simple Analysemöglichkeiten wie Sortierung/Gruppierung oder Anwendung von Grundrechenarten (z.B.
Aggregation in einem OLAP Modell) hinausgeht. Die gängigsten Verfahren der fortgeschrittenen Analyse aus der Statistik und dem maschinellen Lernen dienen der Mustererkennung in Daten, womit vor allem mehrdimensionale Einflussfaktoren auf die Bildung von Segmenten, Feststellung von Abhängigkeiten oder die Vorhersage von Werten oder Klassenzugehörigkeiten (Predictive Analytics) einbezogen werden können. Die Nachfrage nach der Nutzung bzw. Cheat Sheet: Data Visualization with R. Data Science Central Tutorials 16 members Description This is the place to post or read articles about implementations (linear or logistic regression, clustering, visualization, Hadoop, decision trees, collaborative filtering, etc.) using software (RapidMiner, Tableau, SAS, Pivotal, Teradata, SPSS etc.)
Comments Discussions Members. Cheat Sheet: Data Visualization with R. RStudio – Cheatsheets. Advanced R Environments, data structures, functions, subsetting and more, by Arianne Colton and Sean Chen. Updated February 2016. Download. Visualization of data science patterns. How to Become a Data Scientist. These days you can get a degree in data science so you can show your diploma that certifies your credentials. But these are relatively new so, with all due respect, if you only recently got your degree you are still a beginner. Those of us who use this title today most likely came from combination backgrounds of business, hard science, computer science, operations research, and statistics.
What you call yourself is one thing but what your employer or client is looking for can be quite a different kettle of fish. A lot has been written about data scientists being as elusive as unicorns. Not being a unicorn I’d say this sets the bar pretty high. All of this confusion over what we’re called and what we actually do can make you down right schizophrenic.
HP extends R programming language for big data use. Hewlett-Packard has devised a way to run programs written in the R statistical programming language against data sets that span more than one server, potentially paving the way for large-scale, real-time predictive analytics. Data Science Use Cases. Ataccama - DQ Analyzer. SAP Design Studio Archives - Visual BI Solutions. Fundamental methods of Data Science: Classification, Regression And Similarity Matching. Part 1: Integrating R with Web Applications : Business Intelligence, Analytics & Excel. *** UPDATE: On 1/23/2015 Surprise! Microsoft announced the acquisition of Revolution Analytics. This is great news and as a result I will be adding that solution option into this mix along with Azure ML R Web Service. Kahn Academy - Probability and Statistic. Coursera - Data Science Specialization.
Data Mining Map. R project. Data Science. Kaggle. For any industry, we use the power of the world's largest community of data scientists to solve your data problem in a competitive framework, to improve the modeling power further and further from one participant to the next. The winners provide the very top models and code in exchange for prize money. In fact, a stellar list of companies, governments, and researchers have posted their datasets on Kaggle to beat their pre-existing benchmarks. The 6 Skills Required to be a Good Data Scientist - ANZ Blog. 10 things statistics taught us about big data analysis.