

Visuwords™ online graphical dictionary and thesaurus. yEd - Graph Editor. The following diagrams were created and submitted by happy yEd users.
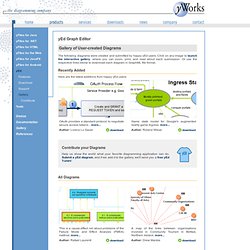
Click on any image to launch the interactive gallery, where you can zoom, print, and read about each submission. Or use the respective links below to download each diagram in GraphML file format. Recently Added. Cool Infographics - Blog. Online Visualization and Organization Tools. The battle of Stalingrad. More about the battle of Stalingrad The battle of Stalingrad began on the 19th August 1942.

Taking Stalingrad would have given Germany access to key oilfields, however the dogged resistance of the Red Army forced them to fight house-to-house. 15 Effective Tools for Visual Knowledge Management. Since I started my quest a few years ago searching for the ultimate knowledge management tool, I’ve discovered a number of interesting applications that help people efficiently organize information.
There certainly is no shortage of solutions for this problem domain. Many tools exist that offer the ability to discover, save, organize, search, and retrieve information. However, I’ve noticed a trend in recent years, and some newer applications are focusing more on the visual representation and relationship of knowledge. I believe this is in part due to the wider adoption of mind mapping (and concept mapping), and leveraging concepts and advances in the semantic web community. Most traditional personal knowledge management (PKM) or personal information management (PIM) applications offer the same basic set of features: These are essential features, however don’t offer too much to the more visually-inclined knowledge junkies. 15.
Link: Platforms: Win, Mac, Linux Cost: Free (Open Source) 14. Visualizing.org: a New Shared and Free Resource on Data Visualization. Visualizing [visualizing.org] has just been released as the latest online player in the ever-increasing blogosphere about the topic of data visualization.
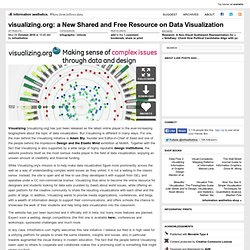
But Visualizing is different in many ways. For one, the man behind the Visualizing initiative is Adam Bly, founder and Editor-in-Chief of Seed and one of the people behind the impressive Design and the Elastic Mind exhibition at MoMA. Together with the fact that Visualizing is also supported by a wide range of highly reputable design institutions, the website positions itself as the most serious media player in the field of data visualization, enjoying an unseen amount of credibility and financial funding. Visualizing.org. Downloads. USI HSG Knowledge Communication - Tools. Graph Visualization Software. VKB Homepage. Sparkline - home. Christopher Baker. Email became an integral part of my life in 1998.
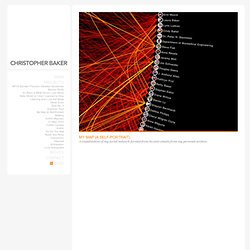
Like many people, I have archived all of my email with the hope of someday revisiting my past. I am interested in revealing the innumerable relationships between me, my schoolmates, work-mates, friends and family. This could not readily be accomplished by reading each of my 60,000 emails one-by-one. Instead, I created My Map, a relational map and alternative self portrait. Triptrop NYC: extraordinarily pretty subway maps from anywhere to everywhere in new york city. Information Visualisation. Services, Resources and Tools for Mapping Data — Making Governme. Long ago, putting together a map of data points would be the sole domain of a skilled GIS practitioner employing an application like ArcView.
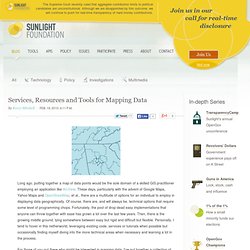
These days, particularly with the advent of Google Maps, Yahoo Maps and OpenStreetMap, et al., there are a multitude of options for an individual to employ in displaying data geographically. Thanks for choosing Tableau Public. Your download should begin automatically, but if it doesn’t, click here.
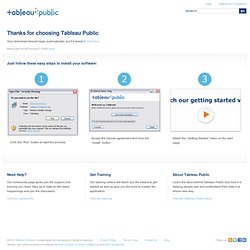
Need the 64-bit version? Click here. Just follow these easy steps to install your software: Click the “Run” button to start the process. Depending on your browser, you might not get the security warning screen.Go to step 2. Accept the license agreement and click the “Install” button. The software will automatically begin the installation process. Features. Enhanced Pathways and Presentation Tools VUE’s unique pathways tool now supports the construction of interactive presentations.
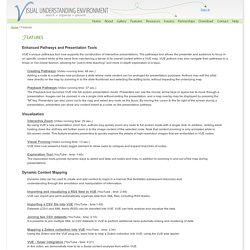
The pathways tool allows the presenter and audience to focus in on specific content while at the same time maintaining a sense of its overall context within a VUE map. VUE authors may also navigate their pathways in a linear or non-linear fashion, allowing for “just-in-time teaching” and more in-depth exploration of a topic. Creating Pathways (Video running time: 48 sec.) Adding a node to a pathway now produces a slide where node content can be arranged for presentation purposes. ENGLISH USER GUIDE.
Many Eyes- data visualization!!!!!! sweet. Data Visualization Framework. Products: Google Browser. Use this free Java application to explore the connections between related websites.
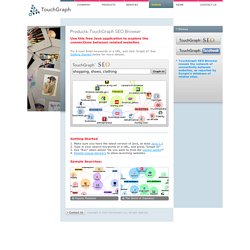
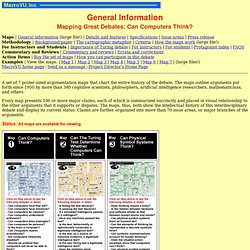
Try it now! Enter keywords or a URL, and click 'Graph it! ' See Getting Started below for more details. Getting Started Make sure you have the latest version of java, at least Java 1.5 Type in your search keywords or a URL, and press "Graph It! " Sample Searches: CCT General Information. General InformationMapping Great Debates: Can Computers Think?
Maps | General information (large file!) | Details and features | Specifications | Issue areas | Press release Methodology | Background paper | The cartographic metaphor | Criteria | How the maps work (large file!) HORN-Home Page-Stanford.