
Mark Lombardi - Artiste conspirateur. L’artiste new-yorkais Mark Lombardi s’est fait connaître grâce à ses sociogrammes, diagrammes en réseau à la fois complexes et étonnamment limpides, détaillant les structures labyrinthiques du pouvoir politico-économique.
Flux d’argent, abus de pouvoir, liens troubles entre personnalités américaines (notamment George W. Bush) et réseaux criminels étrangers… : d’inextricables masses d’informations se démêlent sous les yeux du spectateur, construisant une cartographie, pour le moins dérangeante, de la mondialisation. La mort soudaine de Lombardi en 2000 – officiellement par suicide – a éveillé bien des soupçons quant à la fiabilité des enquêtes officielles : indéniablement, cet homme en savait trop. Quel rôle son œuvre clé BCCI a-t-elle joué dans les enquêtes du FBI autour des attentats du 11-Septembre ? En se penchant sur l’œuvre singulière d’un boulimique de l’information, ce documentaire dévoile la face cachée du milieu de l’argent et de la politique.
Few, Stephen. Fry, Ben. Yau, Nathan: FlowingData. Francesco Franchi – Infographics. Analisi Grafica Published every month on IL – Intelligence in lifestyle An information graphic has to be an intelligent representation.
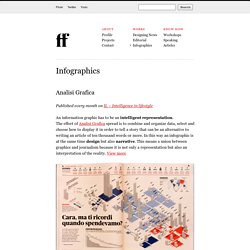
The effort of Analisi Grafica spread is to combine and organize data, select and choose how to display it in order to tell a story that can be an alternative to writing an article of ten thousand words or more. In this way an infographic is at the same time design but also narrative. This means a union between graphics and journalism because it is not only a representation but also an interpretation of the reality. Letteratura Grafica Published on IL – Intelligence in lifestyle Letteratura Grafica, through non-linear infographic language, aims to translate into two-dimensional spaces the relationships and connections between the characters and the elements of the story.
Other infographics Published on IL – Intelligence in lifestyle and other magazines All the infographics are available in higher resolution on my Flickr. Manuel Lima: The Power of Networks: Knowledge in an age of infinite interconnectedness. A Periodic Table of Visualization Methods. Career of the Future: Data Scientist [INFOGRAPHIC] Want a job where the talent is scarce — and likely to remain that way for at least the next five years?
![Career of the Future: Data Scientist [INFOGRAPHIC]](http://cdn.pearltrees.com/s/pic/th/career-scientist-infographic-21495182)
Become a data scientist. That, at least, is the conclusion of a global survey of the number-crunching professionals by IT service company EMC. Some 63% of data scientists say the profession is going to be undermanned for the foreseeable future — and half of those see it as a serious shortage. In particular, the explosive growth of sensors — the so-called "physical Internet" — will provide organizations with an unprecedented wealth of data. O'Reilly, Tim. Heer, Jeffrey. Converge to Inspire. Driven by data.
Tufte, Edward.