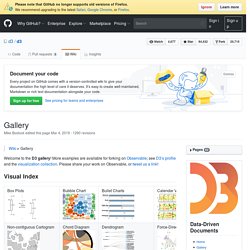

Highcharts - Interactive JavaScript charts for your webpage. Amoeba. The Web 2.0 Summit Map - The Data Frame. Nagios XI Screenshots. Screenshots. Map of the Market. Pikko - Visualisation d’Information. VisionLink. Raphaël · Punch Chart. Gallery · mbostock/d3 Wiki. Wiki ▸ Gallery Welcome to the D3 gallery!

More examples are available for forking on Observable; see D3’s profile and the visualization collection. Please share your work on Observable, or tweet us a link! Visual Index.
JavaScript InfoVis Toolkit. Social Map. Processing.js. Incremental Delaunay Triangulationby Jeonggyu Lee An interactive implementation of incremental Delaunay Triangulation algorithm.

My Life Aquaticby David Leibovic, Sunah Suh A shared aquarium Source code.