background preloader

Visualize

Facebook Twitter

Graph Visualization and Social Network Analysis Software | Navigator - TouchGraph.com. HeliosJS by entrendipity. HeliosJS is an in-memory graph database for modern browsers. 
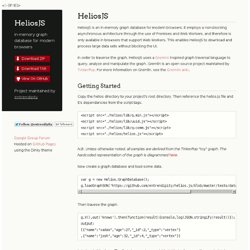
It employs a non-blocking asynchronous architecture through the use of Promises and Web Workers, and therefore is only available in browsers that support Web Workers. This enables HeliosJS to download and process large data sets without blocking the UI. In order to traverse the graph, HeliosJS uses a Gremlin inspired graph traversal language to query, analyze and manipulate the graph.

Gremlin is an open source project maintained by TinkerPop . For more information on Gremlin, see the Gremlin wiki . Getting Started Copy the helios directory to your project's root directory. N.B. Now create a graph database and load some data. var g = new Helios.GraphDatabase(); g.loadGraphSON(' Then travese the graph. Lets break this down. The next step loads data into the database using the loadGraphSON function. Once the data is loaded we travese the graph. Top. D3.js - Data-Driven Documents. 38 Tools For Beautiful Data Visualisations | Elisa DBI. As we enter the Big Data era, it becomes more important to properly expand our capacity to process information for analysis and communication purposes. 
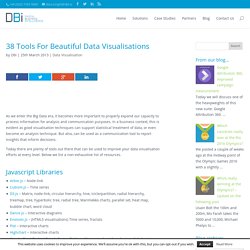
In a business context, this is evident as good visualisation techniques can support statistical treatment of data, or even become an analysis technique. But also, can be used as a communication tool to report insights that inform decisions.

Today there are plenty of tools out there that can be used to improve your data visualisation efforts at every level. Below we list a non-exhaustive list of resources. Javascript Libraries Circular Hierarchy – D3.js Python Libraries Kartograph.py – Mapsigraph – Node-link, treesMatplotlib – Most types of statistical plotsPycha – Pie chart, bar chart, area chartNetworkX – Node-link Java / PHP Web Applications TileMill – Running Map Programming Languages Hyperbolic Tree – NYTimes 365/360 Generated with Processing Desktop Applications Treemap – Tableau.

Processing.org. Raphaël—JavaScript Library. JsPlumb 1.3.16 demo - jQuery. Force-Directed Graph.