
Working with Data in Protovis on Datavisualization. Protovis is an open-source Javascript visualization library by the Stanford Visualization Group and has become one of the preferred tools in our arsenal.
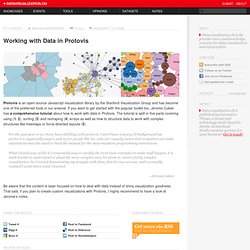
If you want to get started with the popular toolkit too, Jerome Cukier has a comprehensive tutorial about how to work with data in Protovis. The tutorial is split in five parts covering using (1, 2), sorting (3) and reshaping (4) arrays as well as how to structure data to work with complex structures like treemaps or force-directed layouts (5). For the past year or so I have been dabbling with protovis. Be aware that the content is laser focused on how to deal with data instead of shiny visualization goodness. 10 Best Data Visualization Projects of the Year – 2010.
Data visualization and all things related continued its ascent this year with projects popping up all over the place.
Some were good, and a lot were not so good. More than anything, I noticed a huge wave of big infographics this year. En 1 image.