
PerfectTweetsInfographic.jpg (800×608) Wealth Inequality in America. 14 Infographics to Help Organize Your Kitchen. With the right preparation and setup, your kitchen can be a magical place where you create the most amazing gustatory sensations.
Without the right preparation? That space could become, at worst, the scene of a culinary disaster — and at best, a messy place where you just cooked a mediocre meal. The 14 infographics below have one main purpose, above all: to help you find the right tools for your kitchen and enable you to cook in it the culinary feats you’ve always imagined yourself preparing. One of the most common reasons a recipe fails is because of incorrect quantity conversions.
To help keep that from happening, these next few guides can help head off those calculations. Conversions aren’t the only important information to have in the kitchen, though. The Splendiferous Array of Culinary Tools shows how wide of an array there is of kitchen gadgets, and the general purpose each of them serves. It’s also important to know what food to stock and how long it lasts. The Shelf Life of Food. Foods unopened, COUNTER/PANTRY REFRIGERATOR FREEZER uncut or uncooked unless stated otherwise 1 DAY 1 MONTH 1 DAY 3 MONTH 1 MONTH 1 YEAR MACARONI & CHEESE 3-5 days PIZZA 3-4 days SALAD WITH DRESSING 3-5 days SANDWICHES 1-2 days SPAGHETTI & MEAT BALLS 1-2 days What's the Deal with Expiration Dates?
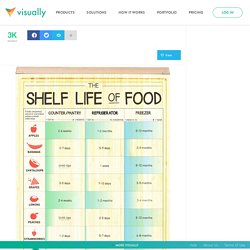
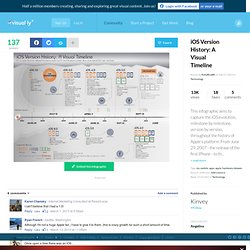
The little dates you find food packages refer to quality, not safety, if properly stored, you can eat food beyond its expiration. It is always best to use your eyes and nose to check for possible food safety issues. iOS Version History: A Visual Timeline. THE BEGINNING iOS 1.0 Core iOS UI Multi-touch gestures Mobile Safari iPod Visual Voicemail Maps iTunes Sync Hidden file system Spotlight Search Introduced iOS 3.0 Spotlight search New dev APIs Cut, copy, paste Voice Control MMS Push notifications USB & Bluetooth tethering Landsacepe keyboard Find My iPone Video recording Autofocus in camera app Direct purchase in iTunes Parental Controls In-app purchases Subscriprions in app store P2P connections iPod music in 3rd party apps HTML5 in Safari iOS 4.0 FaceTime Arrives FaceTime video chat Multitasking Home screen folders Unified-email inbox Retina Display support iAd support Notifications w/ scheduled alerts Task completion in background Fast app switching/saved state Music apps can play in background First free iPod Touch update iOS 5.0 World Meets Siri Siri Notification Center customization Keyboard updates PC-free iTunes Wi-Fi Sync iMessage iCloud iOS 2.0 App Store MobileMe Native 3rd-party apps Microsoft Exchange sup Contact search Sources:
Is content shaping our travel choices? [infographic] Increasingly, content is having a significant impact upon the travel and tourism industry.
![Is content shaping our travel choices? [infographic]](http://cdn.pearltrees.com/s/pic/th/content-shaping-infographic-52352812)
In fact, content is shaping the choices travellers make when it comes to hotels, restaurants, activities and even the destinations themselves. Websites like TripAdvisor have fuelled the world’s consumption of review-based content, whilst travel inspiration tools and guides have been created by some of the biggest travel providers in the world – in reaction to demand from the public. It’s perhaps no surprise that holiday-makers’ reliance upon informative content has grown, given that in the current economic climate, holidays are a real luxury.
Data lenses. The lens can filter several types of information layers: the line numbers of buses currently stationary at each bus stop, the number of passengers on each bus and the aggregate paid fares by passengers alighting at any one stop.
Users can rapidly switch between these information layers to explore correlations between bus lines, stops, waiting times, passenger load and paid fare prices. How 'big data' is changing lives. 25 February 2013Last updated at 20:08 ET Data is increasingly defining us - from the information we share on the web, to that collected by the numerous companies with whom we interact.
Intrigued by the sheer scales involved, photojournalist Rick Smolan wanted to see how data was transforming the world. Take a look at his global snapshots - compiled in his book The Human Face of Big Data. Continue reading the main story To see the enhanced content on this page, you need to have JavaScript enabled and Adobe Flash installed. Click bottom right for image information and full credits. All images subject to copyright. Additional images courtesy Google Maps. Slideshow production by Jane Wakefield and Paul Kerley. Related: Infographics & Data Visualization. 4 Reasons Why Infographics Will Rule The Internet.
Popular Today in Business: All Popular Articles The internet as a burgeoning industry has far and wide reaching potential to come in contact with a majority of people around the world.
This in mind, businesses are jockeying for position in a way to come up with the best position to reach a larger customer base. The internet, then, has become a fast-paced virtual environment where the attention spans of its users are controlled by the content they are viewing and the speed at which they receive it. A way companies and organizations are exploiting this fact is by creating infographics. Because the internet has become such a resource for various information, users are able to accrue limitless information of many different topics. Infographics. Infographics. Sugar yum. Data Visualization, Information Design and Infographics. Infographics. Blog About Infographics and Data Visualization - Cool Infographics.