
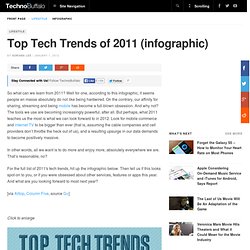
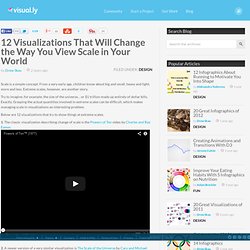
Les outils de data visualisation [présentation powerpoint] Digital Divide: If You're Reading This, You're One of the Lucky Ones [INFOGRAPHIC] Even in the richest countries on the planet such as the U.S., not everyone has easy access to this cornucopia of connectivity, the Internet.
![Digital Divide: If You're Reading This, You're One of the Lucky Ones [INFOGRAPHIC]](http://cdn.pearltrees.com/s/pic/th/digital-reading-infographic-22735517)
The Internet is a tremendous growth engine, responsible for 21% of economic growth in the more advanced countries in the world, according to a McKinsey study. While those of us in the United States complain about how we have to pay more for Internet service that's slower than those of other first-world countries, within the United States there's a gaping chasm between the haves and the have-nots. In this infographic by OnlineITdegree.net, an ad-free website describing itself as "an online informational resource for individuals looking to pursue IT degree of related education and careers," you'll find surprising information about the differences in Internet access in the United States.
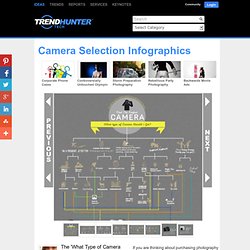
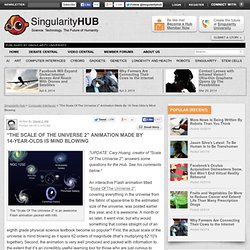
Physics or Fashion? What Science Lovers Link to Most [Interactive] People who are intrigued with physics are somewhat intrigued with computer science, too, but they are crazy about fashion.
![Physics or Fashion? What Science Lovers Link to Most [Interactive]](http://cdn.pearltrees.com/s/pic/th/interactive-scientific-81447770)
Who knew? Top Tech Trends of 2011 (infographic) Stay Connected with Us!
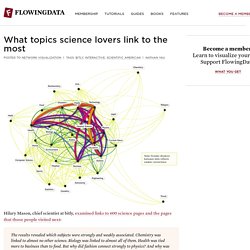
Follow TechnoBuffalo. Internet of Things. Surface. The Manual Photography Cheat Sheet. The Manual Photography Cheat Sheet by Miguel “Mig” Yatco is a very cool infographic for anyone who is ready to move off of Automatic Mode on their camera! Yes, that means you! Quit taking average photos with average settings! No matter if you shoot with film or digital, understanding of these four aspects of photography are key to taking good shots. Submarine-cable-map-2012.telegeography.com. Camera Selection Infographics - The 'What Type of Camera Should I Get' Chart is Realistic.
If you are thinking about purchasing photography equipment, consider checking out the 'What Type of Camera Should I Get' infographic before buying more than what you need.
Although many assume a DSLR is the ideal choice, it is important to consider what you really use your camera for before blowing hundreds on a high-powered device. A DSLR is ideal for those who practice photography as their profession or when photo quality is of the upmost importance. If you are looking for DSLR quality without the bulk, mirror-less interchangeable lens cameras are quickly popping up on today's market. But if you see yourself taking everyday photos of your friends at parties, consider saving your money for brewskis and opt for a compact camera or simply use your phone's camera. What topics science lovers link to the most.
Hilary Mason, chief scientist at bitly, examined links to 600 science pages and the pages that those people visited next: The results revealed which subjects were strongly and weakly associated.
Chemistry was linked to almost no other science. Biology was linked to almost all of them. Health was tied more to business than to food. The Elements Revealed: An Interactive Periodic Table. In the October 2011 issue of Scientific American, we celebrate the International Year of Chemistry. Learn more about its impact on our daily lives in our Special Report. UPDATED: 06/18/2013 In honor of the 2013 Lindau meeting, which focuses on chemistry, we have updated our interactive periodic table with links to Nature Chemistry's In Your Element essay series.
Each essay tells the story of a particular element, often describing its discovery, history and eventual uses. Metals That Enable Our Gadgets Are Vanishing. End-of-theLine-Camden-Asay-Full.jpg (2550×1650) Mining and Metals. History of the U.S. Space Shuttle Program. Planets Large and Small Populate Our Galaxy (Infographic) Buy This Infographic as a Full-Size Poster.

NASA's Virtual Snow Globe Looks at 10 Years of the White Stuff. NASA has released a video that highlights where snow graced the Earth during every month for more than 10 years.
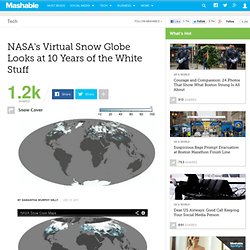
The clip starts with a snow-covered map of the Earth on February 2000 and runs all the way up until last month. The maps show observations collected by the Moderate Resolution Imaging Spectroradiometer (MODIS) on NASA’s Terra satellite. Snow cover is depicted by color, from medium blue (greater than 0%) to white (100%). 12 Visualizations That Will Change the Way You View Scale in Your World. Scale is a simple concept.
From a very early age, children know about big and small, heavy and light, more and less. Extreme scales, however, are another story. Try to imagine, for example, the size of the universe… or $1 trillion made up entirely of dollar bills. Exactly. Grasping the actual quantities involved in extreme scales can be difficult, which makes managing scale in visualizations an interesting problem. Below are 12 visualizations that try to show things at extreme scales. “The Scale Of The Universe 2″ Animation Made By 14-Year-Olds Is Mind Blowing.
The "Scale Of The Universe 2" is an awesome Flash animation packed with info.
*UPDATE: Cary Huang, creator of “Scale Of The Universe 2″, answers some questions for the Hub. See his comments below. . * Infographic Captures The Amazing Scale Of Space, Through Scrolling. How Much Americans Spend on Electronics [INFOGRAPHIC] Think you've got bad gadget spending habits?
![How Much Americans Spend on Electronics [INFOGRAPHIC]](http://cdn.pearltrees.com/s/pic/th/electronics-infographic-19423468)
If you're a single male between the ages of 50 and 65 living in San Jose, Calif. your tech splurges might be par for the course, according to research by Bundle.com. By aggregating anonymous data from the U.S. government, banks and other third-parties, Bundle has broken down Americans' gadget spending by city, age, household type and income level. History of Apple. Apple iPad Buyer Is a Male, Pet-Owning Gamer. Apple Evolution: 30 Years in 2 Minutes. Android Market: 10 Billion Downloads. Google's celebrating a pretty big app market milestone: 10 billion apps served...er..downloaded. All About The Mobile App Market. Everything you hear about these days is mobile-app this and mobile-app that. But what does the mobile-app market look like? What do people want from apps? And what does the competitive landscape look like when you compare iPhone to Windows to Android? App-market-larger.jpeg (1000×5710)
The Problem with Patents. The Best Airports and Airlines for Tech-Dependent Travelers [INFOGRAPHIC]