
Visualizing #nuclear Tweets with Google Earth. Nuclear Mapping [mapping.jp] (Google Earth Plug-in is required) is a real-time visualization of the tweets (purple) and retweets (red) that contain the hashtag #nuclear.

The representation of this Twitter communication is combined with multicolored circles, which stand for the geographical locations of all nuclear reactors in the world. More detailed information on individual tweets and nuclear reactors can be accessed through selecting the appropriate icons. An interactive timeline slider rounds of the interactivity features. Via Google Earth Blog. Safecast. 311 SCALE. We would like to offer our deepest sympathies to all of those affected by the Great East Japan Earthquake.
Although the destruction of entire towns over an area stretching for 500 kilometers to the north and south is of an almost unimaginable scale, we believe that this immense devastation can be overcome and we hope that during the process of rebuilding the disaster-affected region, we can also discover a path for the future of Japan and the world. The earthquake has also brought the new crisis of radioactive contamination to Japan. Not only is there the physical issue of the cleanup following the nuclear accident, but one of the first steps on the path to recovery must be to reduce the negative image which people have of Japan as a country contaminated by nuclear radiation, and thereby lessen the damage to Japanese industry, by presenting the world with an objective look at the current situation – at least within a range that is reasonable to modern science.
_lnnwq4NhNw1qzfnm5o1_1280.jpg (925×1280) 国・自治体による高さ1m・0.5m計測を中心とした放射線量マップ Radiation dose measured by MEXT and local governments at 1 or 0.5 meter height. Color#5(new 0.15/0.23) 38up μSv/h ( triangle : 信頼度の低いデータ measured by GM tube or unknown detector) 当図は様々な測定をいっぺんに表示したものなので、あくまでも参考程度にご覧ください。
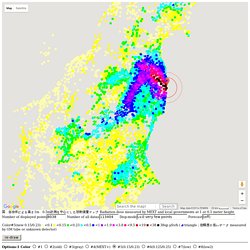
また、基本的に2011年9月末までの測定を入力しています(それ以降に測定開始したところは入力していることもあります)。 なお、よく言われている平時の一般人限度 1mSv/年 とは、自然放射線量(バックグラウンド)を除いた値です。 現在のリアルタイム線量については、こちらのページをご覧ください。 点数が多いため、基本的に間引き表示をしています(Lv0)。 Xenon-133 Northern hemisphere - radiation. Iodine-131 Japan - radiation. Radiation visualizations paint a different picture of Japan - O'Reilly Radar. Over the weekend I came across some data on levels of radiation in Japan collected by the Japanese government, and helpfully translated into English by volunteers.
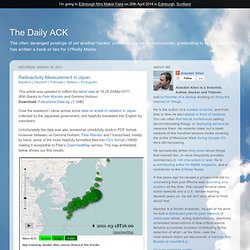
Unfortunately the data was also somewhat unhelpfully stuck in PDF format. However between us Gemma Hobson, Pete Warden and I transcribed, mostly by hand, some of the more helpfully formatted files into CSV format (16KB) making it acceptable to Pete's OpenHeatMap service. The map embedded below shows our first results. As you can see from the visualisation environmental radiational levels change fairly minimally over the time course of the day. Most measurements are steady, and within the historic ranges, except around the troubled Fukushima plant where readings are about double normal levels. Things become more interesting however when we look at the historic baseline data, the two maps below show the typical range of background environmental radiation in Japan. Radiation Dose Chart. #geigermaps. Pachube - data infrastructure for the Internet of Things.