
Global Maps. Sea Ice Max Continues Downward Trend. In September 2012, the ice cap over the Arctic Ocean shrank to its lowest extent on record, about half the size of the average summertime extent from 1979 to 2000.
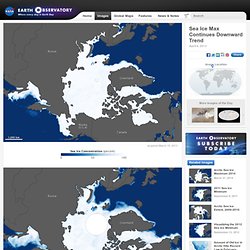
That sea ice minimum continued a long-term trend of diminishing ice cover over the past few decades. During the darkness and bitter cold of Arctic winter, new sea ice forms and older ice re-freezes and grows. This growth typically reaches its maximum extent in late February or early March. Wondersoftheworld.tv. 2011 Global Temperatures. Nine of the top ten warmest years in the modern meteorological record have occurred since the year 2000.
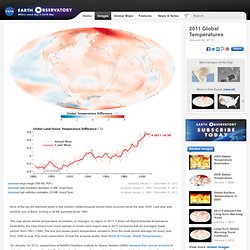
Last year was another one of them, coming in at 9th warmest since 1880. The map above shows temperature anomalies, or changes, by region in 2011; it does not depict absolute temperature. Essentially, the map shows how much warmer or cooler each region was in 2011 compared with an averaged “base period” from 1951–1980. Le blog de l'image satellite – CNES.