
GOOD Argument Parsing. Datalogger example using Sense Hat, InfluxDB and Grafana. Introduction In this article we will make a simple datalogger application running on the Raspberry Pi.
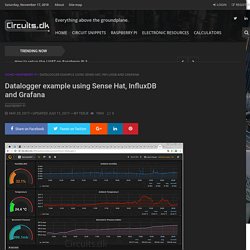
It is compatible with Raspberry Pi Zero W, Pi 2 and Pi 3. DefinIT. I recently started looking into ways of monitoring the temperature and humidity in my garage – for two reasons.
Firstly, I have my lab workload cluster out there in the form of a Dell C6100, and I’ve noticed with the recent weather that the temperature in there gets…a bit warm. Secondly, I like to brew beer at home, and one of the keys to a good brew is consistent temperature! I also want to kick the tyres with some new skills – Python, InfluxDB and Grafana all seem pretty useful skills to acquire. Thanks to Datrium sponsoring the vExpert programme I have a Raspberry Pi 3 lying around at home doing nothing, so I did some reseach and ordered an inexpensive (£6) temperature and humidity sensor, the AM2302, which is based on the DHT22, but with a resistor and pins pre-wired: Connecting the three pins to the GPIO on the Pi is simple using a map of the Raspberry Pi, I used:
Datalogger example using Sense Hat, InfluxDB and Grafana. Datalogger example using Sense Hat, InfluxDB and Grafana. InfluxData Documentation. Warning!
This page documents an earlier version of InfluxDB, which is no longer actively developed. InfluxDB v1.7 is the most recent stable version of InfluxDB. Before diving into InfluxDB it’s good to get acquainted with some of the key concepts of the database. This document provides a gentle introduction to those concepts and common InfluxDB terminology. We’ve provided a list below of all the terms we’ll cover, but we recommend reading this document from start to finish to gain a more general understanding of our favorite time series database. Check out the Glossary if you prefer the cold, hard facts. Sample data The next section references the data printed out below. Raspberry Pi Data Logger with InfluxDB and Grafana – John Whittington Engineer. A need popped up at work for a data logger for various lab tasks.
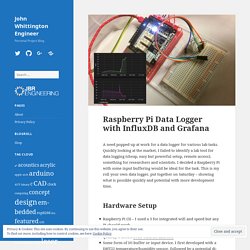
Quickly looking at the market, I failed to identify a lab tool for data logging (cheap, easy but powerful setup, remote access); something for researchers and scientists. I decided a Raspberry Pi with some input buffering would be ideal for the task. This is my roll your own data logger, put together on Saturday – showing what is possible quickly and potential with more development time. Hardware Setup Raspberry Pi (3) – I used a 3 for integrated wifi and speed but any Pi should work.SD Card – A reliable brand as the database will be writing frequently. Raspbian Stretch Headless Setup on Raspberry Pi - Hobbytronics PK. No Keyboard, Mouse, Display, HDMI or USB Converter is required for Raspbian Stretch Headless Setup!!
Raspbian Stretch Headless Setup works on Raspberry Pi 3 and Pi Zero W Contents: Months back, We had published a guide for setting up Raspbian Jessie on Raspberry Pi without Keyboard, Mouse and External Display. How to set up Smart Metering with Raspberry Pi zero, InfluxDB and Grafana. References: official guide Raspberry Pi (zero) The setup:
Running the TICK Stack on a Raspberry Pi. The Raspberry Pi is a great platform for the TICK Stack! Since its introduction in 2013, the Raspberry Pi platform has grown by leaps and bounds, gaining popularity and showing up in projects all over world, from quick hacks to fully commercialized products. It’s an inexpensive, low power, open-source, single-board computer with a variety of interfaces for connecting with sensors and actuators that can be used to interact with the physical world.
It’s also a solid choice when you need an always-on device for collecting data, and it’s powerful enough to run the complete TICK Stack. Raspbian Stretch Headless Setup on Raspberry Pi - Hobbytronics PK. Raspberry Pi 3 with Mosquitto, Node-RED, InfluxDB, Grafana and Nginx (as a reverse proxy) Raspberry Pi 3 IoT Home Server Presentation (Catalan) Get the latest image and flash the SD card download the latest image $ wget --output-document=raspbian.img.zip locate the destination volume $ unzip -p raspbian.img.zip | sudo dd of=/dev/mmcblk0 bs=4M conv=fsync mount the SD cardwindows users might want to install to read/write EXT4 partitionslocate the boot and rootfs partitions (on bare Windows machines only boot partition is visible)enable ssh by default: $ cd /media/$USER/boot $ touch ssh configure the wifi connection (optional): $ cd /media/$USER/boot $ sudo vi wpa_supplicant.conf country=ES ctrl_interface=DIR=/var/run/wpa_supplicant GROUP=netdev update_config=1 network={ ssid="<ssid1>" psk="<pass1>" id_str="Home" priority=1 } # More than one network configuration can be added # This is an open network (no pass) network={ ssid="<ssid2>" key_mgmt=NONE id_str="Open" priority=2 } configure the network interfaces (optional, linux host only): $ ssh -o IdentitiesOnly=yes pi@192.168.1.200.
Actionable Data Using InfluxDB and Node Red. Putting your IoT data into a backend system is great.
Being able to query and visualize your IoT data is even better. Making your IoT data actionable is, really, what should be the ultimate goal of an IoT data system. As we’ve seen in previous posts, the first few things are relatively straight forward and easy to do. How to send sensor data to InfluxDB from an Arduino Uno. Introduction Since InfluxDB is a time series database, it’s the perfect candidate for storing data collected from sensors and various other devices that comprise the Internet of Things.
In this article, we’ll look at a basic use case involving data collection from a temperature sensor connected to an Arduino Uno, then sent to InfluxDB via the native UDP plugin. Why UDP? Since most of the processors present in Internet-enabled devices are designed to be energy-efficient (and thus relatively low-powered) and may also be connected via low-bandwidth links, it’s in our best interest to use communication methods that require as little processing and networking overhead as possible.
Therefore, UDP (User Datagram Protocol) is an excellent candidate for this exercise. Other protocols, such as MQTT, offer data transmission properties that are similar in efficiency to UDP, but require a more complicated client implementation in order to obtain better guarantees about data receipt. ... How to send sensor data to InfluxDB from an Arduino Uno. Using TICK Stack & Google Cloud Platform. Building Better Telegraf Plugin For Beginners [Part Two] Seems like it was just yesterday that I was writing a blog about How To Build a Telegraf Plugin for Beginners.
![Building Better Telegraf Plugin For Beginners [Part Two]](http://cdn.pearltrees.com/s/pic/th/building-beginners-influxdata-186303821)
Wait, that was just yesterday! And yet here I am back again writing another one. If you read yesterday’s post, and read all the way to the end, you’ll remember that I said: Ultimately I’d like to expand and generalize it a bit so that it’s not so specific to my needs—have it parse the readings that it is sent, and put them into the database based on other fields in the JSON I had no sooner hit ‘publish’ on that post than I decided “why not just do it?” On the Particle Device and Cloud Previously, using line-protocol, I published all the readings and tags in one go, so I thought I’d repurpose that for this plugin as well. All the tags and fields and values neatly in one HTTP POST. That publishes a JSON string that, after the Particle cloud is done with it, looks like this: That last field I added with the custom JSON in the Particle.io Integration page like so: On the Plugin Side.
Augmenting IoT Data Through External Data Sources. Intelligent Home Automation from Collecting IoT Data. “Metrics First” Approach to Log Analysis. Writing Logs Directly to InfluxDB. Back in June we published a blog on our “metrics-first” approach to log analysis; we had found that just over a quarter of our users were already using the InfluxData platform for storing logs and non-numerical events.
We consider logs to be just another form of time series data, and so we wanted to give those users better tools for ingesting and viewing that data. At the end of the day, logs are extremely valuable for debugging and troubleshooting; they provide detailed insight into the goings-on of your systems, and let you explore problems in ways that predefined dashboards don’t allow.
We released a plugin for Telegraf that allows you to ingest logs using the syslog protocol, which was based on work we were doing internally, and then back in July, we added log viewing functionality to Chronograf. If you’re interested in getting rsyslog and the Telegraf plugin up and running on macOS or Linux, you should check out the Get Your Syslog On blog post. Tutorial ESP8266 Node-RED Granafa InfluxDB MQTT - PDAControl. Based on the previous instructions of the ESP8266 connection with the Node-RED implementing the mqtt protocol, we have performed tests of the connection of several software platforms for the collection and visualization of data. InfluxDB to store your sensor data. To store sensor data from my mqtt message broker I use influxdb. Influxdb is a time series database to make historical analysis, predictive analysis and anomaly detection.
The nice thing about it, its open source (MIT) and easy to install, though not so easy to configure or manage. In this post I will describe how I use influxdb to archive my data, I will describe how the data goes into influxdb and how I use the retention policies and continuous queries to reduce the amount of data points over time. Influxdb - A brief summary Influxdb uses a totally different approach as relational database (e.g. mysql), it is a so called NoSQL (Not only SQL) database. InfluxDB to store your sensor data. Visualizing Lora Node data with Node-red and Grafana. Introduction: This tutorial is the third in our series of LoraWan IoT projects. Node-red-contrib-influxdb - Node-RED. Node-RED (Tutorial): saving MySensors measurements on InfluxDB. In this tutorial we will see how to record measurements from a DHT22 probe sent via radio waves using the MySensors library using Node-RED in an InfluxDB database.
If you discover the InfluxDB database, see the previous article, which explains how to install it on MacOS or Windows and (rather quickly) how to use it. Raspberry Pi 3 with Mosquitto, Node-RED, InfluxDB, Grafana and Nginx (as a reverse proxy) Actionable Data Using InfluxDB and Node Red.