
7 Basic Rules for Making Charts and Graphs. Charts and graphs have found their way into news, presentations, and comics, with users from art to design to statistics.
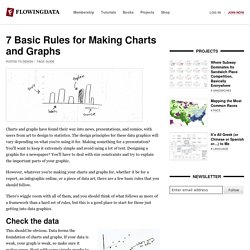
The design principles for these data graphics will vary depending on what you're using it for. Making something for a presentation? You'll want to keep it extremely simple and avoid using a lot of text. Designing a graphic for a newspaper? Data Visualization Blogs You Might Not Know About. Winner of the Personal Visualization Project is… Like what you see here?
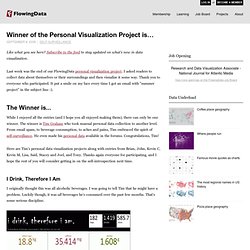
Subscribe to the feed to stay updated on what's new in data visualization. Last week was the end of our FlowingData personal visualization project. I asked readers to collect data about themselves or their surroundings and then visualize it some way. Thank you to everyone who participated. It put a smile on my face every time I got an email with "summer project" in the subject line :).