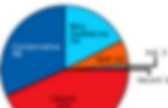

SWF Charts > Gallery > Composite. Online Charts Builder. Hohli Online Charts Builder New version: Try new version of Charts Builder, it based on new Google Charts API Load From Image URL: Chart Data can't equal to original, but very similar to it.

Only for images on chart.apis.google.com Chart Type: 3D Pie charts Lines Bar charts Pie charts For Pie Charts with labels choose 1000x300 or 800x375 size Venn diagrams Scatter plots Radar charts Chart Size: 320x240 Horizontal 1000x300 800x375 600x500 320x240 Vertical 300x1000 375x800 500x600 240x320 Square 546x546 400x400 300x300 200x200 Chart Ads: Data: Should be consists only positive numbers, use minus one (-1) for missing value, separated by coma, space or semi(,; ), e.g.: 23, 432, 456, 341 For Lines (pairs): Input data as x-axis and y-axis coordinates, e.g.: x1,y1, x2,y2, x3,y3 Title: Use a pipe character (|) to force a line break in title. Background: Chart is ready you can save it as image Right click on the chart Select "Save image as" Save the image to your computer © 2011 Charts Builder.
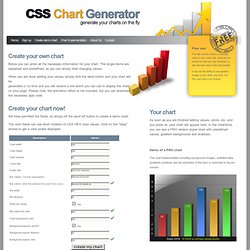
Developed by Anton Shevchuk. CSS Chart Generator. Below you can enter all the necessary information for your chart.

The single items are explained and predefined, so you can simply start changing values. When you are done adding your values, simply click the send button and your chart will be generated in no time and you will receive a link which you can use to display the chart on your page. Please note, the animation effect is not included, but you can download the necessary ajax code. The free version shows a copyright notice in the x-axis title, while the pro version is free from any backlinks or ads and has much more functionality.
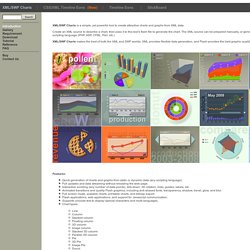
It has not the ability to use gradient images or any other cool stuff. We have pre-filled the fields, so simply hit the send off button to create a demo chart. The color fields can use short notation of CSS HEX color values. As soon as you are finished adding values, colors, etc, and you press ok, your chart will appear here. Demo of a PRO chart. Highcharts - Interactive JavaScript charts for your webpage. CSS3 Click Chart. SWF Charts. XML/SWF Charts is a simple, yet powerful tool to create attractive charts and graphs from XML data.

Create an XML source to describe a chart, then pass it to this tool's flash file to generate the chart. The XML source can be prepared manually, or generated dynamically using any scripting language (PHP, ASP, CFML, Perl, etc.) XML/SWF Charts makes the best of both the XML and SWF worlds. XML provides flexible data generation, and Flash provides the best graphic quality. Features: Quick generation of charts and graphs from static or dynamic data (any scripting language) Full updates and data streaming without reloading the web page.
Testimonials I just wanted to pass along how well your script worked for our stock performance page. Good work! This is amazing software. Just want to thank you for this wonderful upgrade. I purchased your product a couple days ago and first had time to sit down and work with it this morning. Wow, you are the best! Thanks for your great script. THIS ROCKS!