
Correlation. When two sets of data are strongly linked together we say they have a High Correlation.
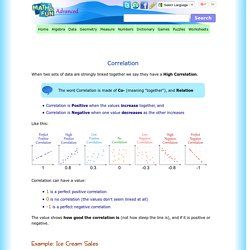
The word Correlation is made of Co- (meaning "together"), and Relation Correlation is Positive when the values increase together, and Correlation is Negative when one value decreases as the other increases Like this: Correlation can have a value: 1 is a perfect positive correlation 0 is no correlation (the values don't seem linked at all) -1 is a perfect negative correlation The value shows how good the correlation is (not how steep the line is), and if it is positive or negative. Example: Ice Cream Sales The local ice cream shop keeps track of how much ice cream they sell versus the temperature on that day, here are their figures for the last 12 days: And here is the same data as a Scatter Plot: We can easily see that warmer weather leads to more sales, the relationship is good but not perfect. In fact the correlation is 0.9575 ... see at the end how I calculated it.
Normal Distribution. Data can be "distributed" (spread out) in different ways.

But there are many cases where the data tends to be around a central value with no bias left or right, and it gets close to a "Normal Distribution" like this: A Normal Distribution The "Bell Curve" is a Normal Distribution. And the yellow histogram shows some data that follows it closely, but not perfectly (which is usual). Many things closely follow a Normal Distribution: heights of people size of things produced by machines errors in measurements blood pressure marks on a test We say the data is "normally distributed". Quincunx Standard Deviations The Standard Deviation is a measure of how spread out numbers are (read that page for details on how to calculate it). When you calculate the standard deviation of your data, you will find that (generally): Example: 95% of students at school are between 1.1m and 1.7m tall. Standard Deviation and Variance.
Deviation just means how far from the normal Standard Deviation The Standard Deviation is a measure of how spread out numbers are.
Its symbol is σ (the greek letter sigma) The formula is easy: it is the square root of the Variance. So now you ask, "What is the Variance? " Variance. Quartiles. Quartiles are the values that divide a list of numbers into quarters.

First put the list of numbers in order Then cut the list into four equal parts The Quartiles are at the "cuts" Like this: Example: 5, 8, 4, 4, 6, 3, 8 Put them in order: 3, 4, 4, 5, 6, 8, 8 Cut the list into quarters: And the result is: Quartile 1 (Q1) = 4 Quartile 2 (Q2), which is also the Median, = 5 Quartile 3 (Q3) = 8 Sometimes a "cut" is between two numbers ... the Quartile is the average of the two numbers. Example: 1, 3, 3, 4, 5, 6, 6, 7, 8, 8. Calculating the mean from a frequency table. It is easy to calculate the Mean: Add up all the numbers, then divide by how many numbers there are.

Example 1: What is the Mean of these numbers? Add the numbers: 6 + 11 + 7 = 24 Divide by how many numbers (there are 3 numbers): 24 ÷ 3 = 8 The Mean is 8 But sometimes you won't have a simple list of numbers, you might have a frequency table like this (the "frequency" says how often they occur): (it says that score 1 occurred 2 times, score 2 occurred 5 times, etc) You could list all the numbers like this: But rather than do lots of adds (like 3+3+3+3) it is often easier to use multiplication: And rather than count how many numbers there are, we can add up the frequencies: So let's calculate: And that is how to calculate the mean from a frequency table!
Here is another example: Example: Parking Spaces per House in Hampton Street Isabella went up and down the street to find out how many parking spaces each house had. Standard Deviation Formulas. Deviation just means how far from the normal Standard Deviation The Standard Deviation is a measure of how spread out numbers are.

You might like to read this simpler page on Standard Deviation first. But here we explain the formulas.