
Juvénal CHOKOGOUE sur Twitter : "Analyzing Airbnb Data using @tableau by @j_trajkovic #bigdata #visualization #analytics. Analyzing Airbnb Data. Great list of resources: data science, visualization, machine learning, big data. Cheat Sheet: Data Visualization with R. Why Your Audience Matters in Data Visualization. Data visualization requires more than design skills.
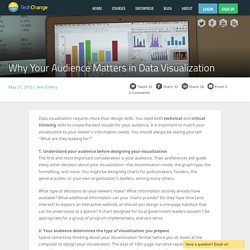
You need both technical and critical thinking skills to create the best visuals for your audience. It is important to match your visualization to your viewer’s information needs. You should always be asking yourself: “What are they looking for?” 1. Understand your audience before designing your visualization The first and most important consideration is your audience. What type of decisions do your viewers make? 2. Visual Reporting Traditional M&E reports are 80% text and 20% graphics.
Online Reporting Maybe your viewers would respond better to a different reporting style altogether—an online report. 3. Draw Attention to key charts with handouts If you are getting ready to share your M&E results during a meeting, rather than printing your full slide deck, select 3 to 5 key charts and print those slides on a full-page. That’s all for my top tips to keep in mind when creating your visualization! About author Ann K. 1. 2. 3. About author. How to Check Visualizations for Accuracy. Drew Skau published on July 18, 2014 in Design It is difficult to tell if many visualizations have been created correctly.
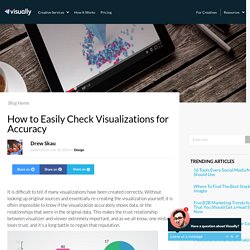
Without looking up original sources and essentially re-creating the visualization yourself, it is often impossible to know if the visualization accurately shows data, or the relationships that were in the original data. This makes the trust relationship between visualizer and viewer extremely important, and as we all know, one mistake loses trust, and it’s a long battle to regain that reputation.
Not all visualizations are difficult to double check though. Pie Charts Pie charts are the easiest visualizations to check for internal consistency. It is also possible to check individual wedges of pie charts. Stacked Charts. 8 cool tools for data analysis, visualization and presentation. Page 4 of 4 PowerPivot What it does: This free plugin from Microsoft allows Excel 2010 to handle massively large data sets much more efficiently than the basic version of Excel does.
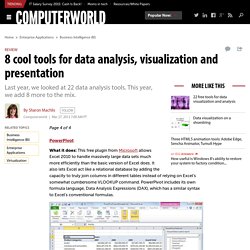
It also lets Excel act like a relational database by adding the capacity to truly join columns in different tables instead of relying on Excel's somewhat cumbersome VLOOKUP command. PowerPivot includes its own formula language, Data Analysis Expressions (DAX), which has a similar syntax to Excel's conventional formulas. The 37 best tools for data visualization. ?utm_reader=feedly&utm_content=buffer718ee&utm_medium=social&utm_source=twitter. You don’t need to be a seasoned data scientist or have a degree in graphic design in order to create incredible data visualisations.
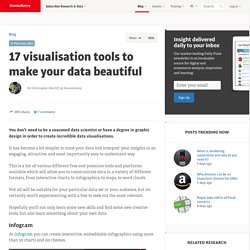
It has become a lot simpler to mine your data and interpret your insights in an engaging, attractive, and most importantly easy to understand way. This is a list of various different free and premium tools and platforms available which will allow you to communicate data in a variety of different formats, from interactive charts, to infographics, to maps, to word clouds. Not all will be suitable for your particular data set or your audience, but its certainly worth experimenting with a few to seek out the most relevant. Hopefully you’ll not only learn some new skills and find some new creative tools, but also learn something about your own data.
Infogr.am At Infogr.am you can create interactive, embeddable infographics using more than 30 charts and six themes. Fusion Tables Piktochart dygraphs Timeline Leaflet Tagxedo Tagxedo is a simple to use word cloud generator. Gregory Piatetsky sur Twitter : "History of #DataScience across 5 strands: CS, #Data, #Visualization, Math, & #Statistics. Impact of big data on analytics. Data visualization: i dati si fanno belli e diventano informazione - Festival Internazionale del Giornalismo. La mappa di tutti gli immobili della PA francese. Share on Tumblr in Share in Share 1 Mentre in Italia si parla di vendita (forse di svendita) dei beni pubblici – dei quali però non esiste una stima precisa – per fare cassa, in Francia pubblicano la mappatura di tutti gli edifici di proprietà della Pubblica Amministrazione. L’utile e interessante iniziativa è stata condotta da data.gouv.fr : si tratta di 25.500 proprietà divise tra ambasciate, terreni, garage, bunker, uffici, ecc. per complessivi 107,5 miliardi di Euro (da notare infatti anche quelle in territorio straniero).
Purtroppo, oltre alla cartografia interattiva e ai report riassuntivi, non troviamo open data né row data esportabili ma solo qualche foglio Excel. Ecco le maggiori difficoltà riscontrate durante la rilevazione dei dati: codici postali errati città non indicata. Infographic of the Day: Nebul.us Graphs Your Lifestream. Internet pundits and VC's have been shouting for some time about the discovery potential of social networking--the idea that your friends and contacts are the best arbiters of what you might like, and that social networking finally makes those exchanges frictionless.

Just one problem: The avalanche of social networking sites--not to mention media sites--makes wading through all the noise an overwhelming, full-time task. That's what Nebul.us is designed to solve. The Web browser plug-in, which was just launched this week in private beta, mines your Internet activity and feeds it back to you in a dynamic infographic. Thus, you can see what you've been reading on blogs, or listening to on last.fm, or tweeting about--all in one chart. It's organized like a clockface, so you can see what you were browsing, at any given point in the day; the width of the bands shows how long you spent, and the height shows how much affiliated content you browsed or created, via Twitter or Facebook.
Mining, Mapping and Visualizing the Blogosphere.