Infographic: Every Trip To The Moon, Ever. Once the U.S. planted a flag on the moon, it was easy to forget the trials and tribulations of the space race.
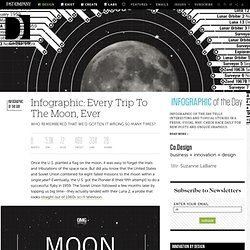
But did you know that the United States and Soviet Union combined for eight failed missions to the moon within a single year? Eventually, the U.S. got the Pioneer 4 (their fifth attempt) to do a successful flyby in 1959. The Soviet Union followed a few months later by topping us big time--they actually landed with their Luna 2, a probe that looks straight out of 1960s sci-fi television. Click to enlarge. It’s a story that you can follow in this pair of infographics created by Margot Trudell as part of her OCAD graduate thesis. But if you like these infographics, you should check out Trudell’s entire graduate thesis, OMG Space.
The pixel-scale chart of our solar system. And then she got really technical, in a graphic design explanation that may make you appreciate the size of our solar system just a little bit more: [Hat tip: Core77] Create and design your own graphs and charts online. XMind - Mind Mapping and Storming. Solution Décisionnelle. Infographics & Data Visualizations [Visual.ly] Desktop. This software has been renamed to Gapminder World Offline Because of technical problems the software on this page is no longer being maintained!

Please visit Gapminder World Offline (Beta) instead. Gapminder Desktop With Gapminder Desktop you can show animated statistics from your own laptop! Install the free software and watch the how-to video with Hans Rosling. Install With the Gapminder World you will be able to:Use the software without internet accessSave a list of your own favorite graphsUpdate automatically to the latest version Video: “How to use Gapminder Desktop” Installation instructions (Windows, Mac and Linux) 1. 2. If you are having trouble installing Gapminder Desktop using the button above you may try an alternative way. 10 Awesome Free Tools To Make Infographics. Advertisement Who can resist a colourful, thoughtful venn diagram anyway?

In terms of blogging success, infographics are far more likely to be shared than your average blog post. This means more eyeballs on your important information, more people rallying for your cause, more backlinks and more visits to your blog. In short, a quality infographic done well could be what your blog needs right now. Designing An Infographic Some great tips for designing infographics: Keep it simple! Ideas for infographic formats include: Timelines;Flow charts;Annotated maps;Graphs;Venn diagrams;Size comparisons;Showing familiar objects or similar size or value. Here are some great tutorials on infographic creation: Creating Your Infographic Plan and research.If required, use free software to create simple graphs and visualisations of data.Use vector graphic software to bring these visualisations into the one graphic.
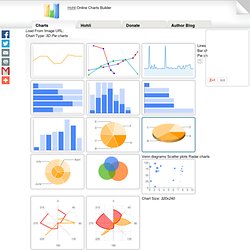
Free Online Tools For Creating Infographics Stat Planet Hohli Creately. Free Data Visualization Software. Online Charts Builder. Hohli Online Charts Builder Load From Image URL: